Kanika surveyed the students of her class to determine their favourite colours. The results are shown in the given bar graph. Study it carefully and answer the following questions.
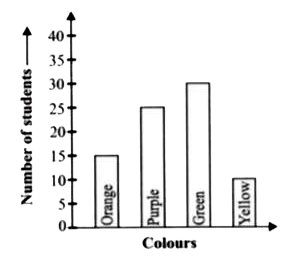
Find the ratio of number of students who like purple colour to the total number of students.
4:5
5:16
16:5
5:4
The correct Answer is:B
Step by step video, text & image solution for Kanika surveyed the students of her class to determine their favourite colours. The results are shown in the given bar graph. Study it carefully and answer the following questions. Find the ratio of number of students who like purple colour to the total number of students. by Maths experts to help you in doubts & scoring excellent marks in Class 6 exams.
Updated on:21/07/2023Topper's Solved these Questions
- IMO QUESTION PAPER 2019-20 SET B BOOK - SCIENCE OLYMPIAD FOUNDATION CHAPTER - IMO QUESTION PAPER 2019-20 SET B EXERCISE - EVERYDAY MATHEMATICS
10 Videos
- IMO QUESTION PAPER 2019-20 SET B BOOK - SCIENCE OLYMPIAD FOUNDATION CHAPTER - IMO QUESTION PAPER 2019-20 SET B EXERCISE - ACHIEVERS SECTION
5 Videos
- IMO QUESTION PAPER 2019-20 SET ABOOK - SCIENCE OLYMPIAD FOUNDATION CHAPTER - IMO QUESTION PAPER 2019-20 SET AEXERCISE - LOGICAL REASONING
1 Videos
- IMO QUESTION PAPER 2020BOOK - SCIENCE OLYMPIAD FOUNDATION CHAPTER - IMO QUESTION PAPER 2020EXERCISE - Achievers section (HOTS)
5 Videos
Similar Questions
Knowledge Check
Study the double bar graph given below and answer the questions.
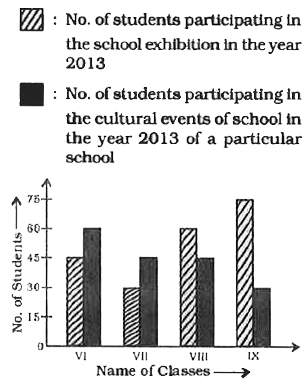
The average of the number of students participating in cultural events isA48.75B52.5C45D50Study the double bar graph given below and answer the questions.
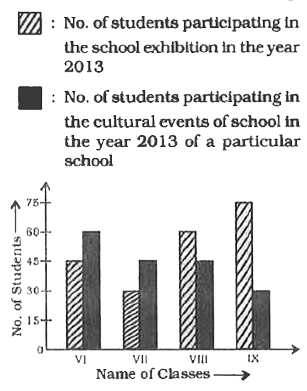
The average of the number of students participating in exhibition isA48.75B52.5C45D50Study the following graph carefully and answer the questions that follow
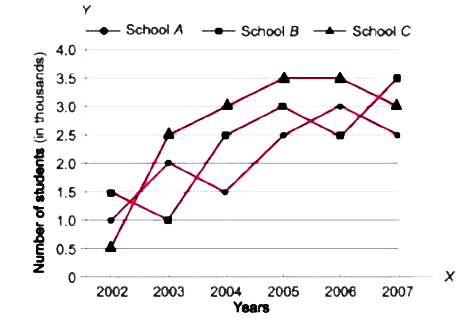
What was the average number of students in all schools together in the year 2006 ?A30000B9000C3000D6000
Study the bar graph and answer the following questions.
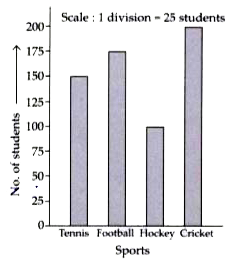
What is the difference between number of students playing football and hockey ?
View SolutionRead the bar graph shown in figure and answer the following questions.
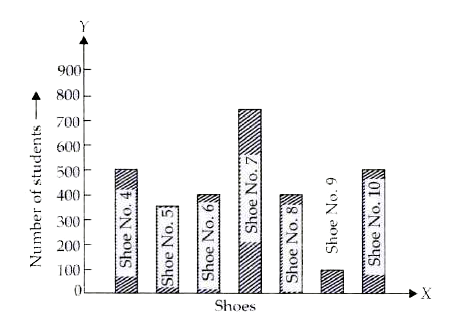
What are the different numbers of the shoesworn by the students?
View SolutionStudy the following bar graph and answer the questions given below.
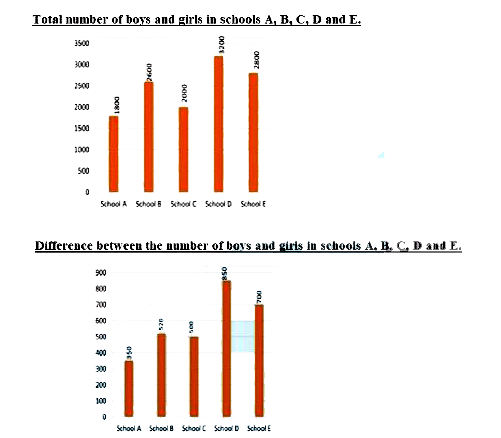
The number of boys in school B is what percentage of the total number of students in that school ?
View SolutionOut of 30 students in a class, 6 like football, 12 like cricket and remaining like tennis.
Find the ratio of :
Number of students liking cricket to total number of students.
View SolutionOut of 30 students in a class, 6 like football, 12 like cricket and remaining like tennis. Find the ratio of
Number of students liking cricket to total number of students.
View Solution

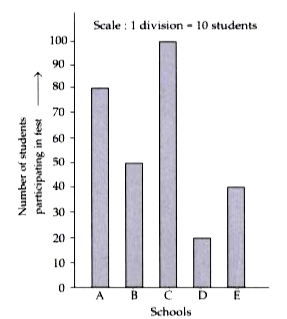 From which school maximum number of students participated ?