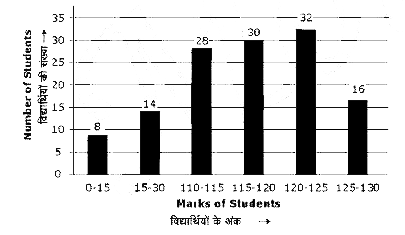
Study the histogram and answer the question given below.
The given graph represents the percentage of marks scored by students in class X Board Examination in 2018 in a school.
Total number of students = 250

The difference between the percentage of students who scored less than 70% marks and the percentage of students who scored 80% and above is:
25%
18%
24%
22%
The correct Answer is:D
Step by step video, text & image solution for Study the histogram and answer the question given below. The given graph represents the percentage of marks scored by students in class X Board Examination in 2018 in a school. Total number of students = 250 The difference between the percentage of students who scored less than 70% marks and the percentage of students who scored 80% and above is: by Maths experts to help you in doubts & scoring excellent marks in Class 14 exams.
Updated on:21/07/2023Similar Questions
Knowledge Check
From the given table, what is the percentage of students scoring 40 or more, but less than 70.
 A0.08B0.56C0.48D0.96
Study the following table and answer the questions.

The total number of students scoring 50% or more marks isA1250B875C775D675Study the given histogram that shows the marks obtained by students in an examination and answer the question that follows .
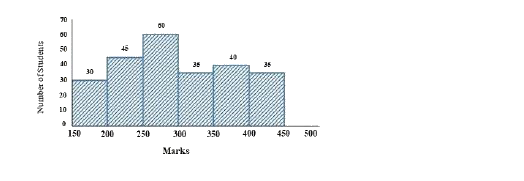
The number of students who obtained less than 250 marks is :A135B75C30D45
Study the following bar graph and answer the questions given below.
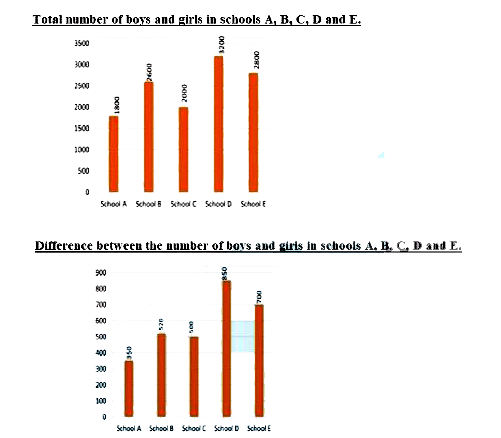
The number of boys in school B is what percentage of the total number of students in that school ?
View SolutionThe following table shows the marks of 90 students in a test of 80 marks :
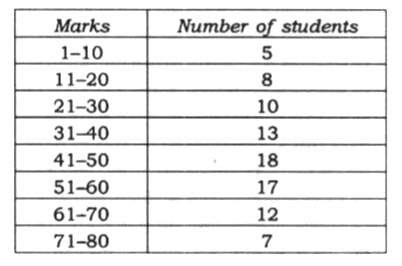
The percentage of students who have obtained less than or equal to 50% marks is
View SolutionThe pie chart given shows the number of marks scored by a student in the given 5 subjects. The total marks scored by the student is 480.
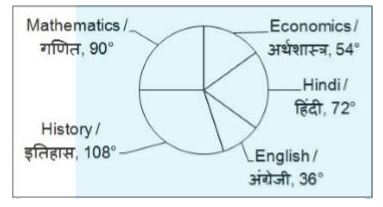
What is the difference between the marks scored by the student in Mathematics and the marks scored in Hindi?
View SolutionStudy the following histogram and answer the given question.
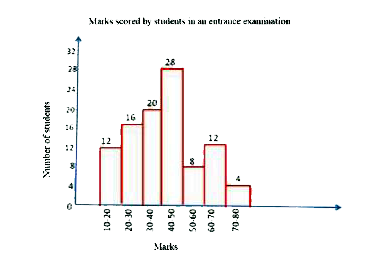
What is the ratio of the number of students who scored 30 or more marks, but below 40 marks, to the total number of students in the entrance examination?
View SolutionThe given bar chart shows number of marks scored by a student in each subject in three years
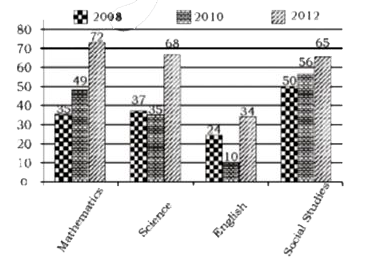
In the given bar chart if number of marks in social studies in year 2012 is 13% of the school strength the number of students is
View Solution

