Study the pie chart and answer the question that follows.
The number of people applying for a passport from a city was monitored, and it was found that the numbers (in multiples of hundred) during the first five months of 2019 were as follows: January (M1)-248, February (M2)-134, March (M3)-162, April (M4)-94, May (M5)-72. These have been represented through the given pie chart.
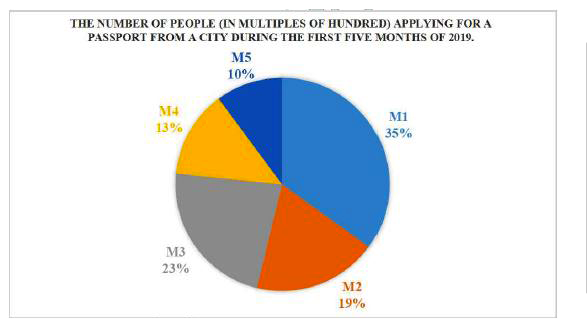
What is the central angle (to the nearest degree) of the sector corresponding to M1?
104
117
132
126
The correct Answer is:D
Step by step video, text & image solution for Study the pie chart and answer the question that follows. The number of people applying for a passport from a city was monitored, and it was found that the numbers (in multiples of hundred) during the first five months of 2019 were as follows: January (M1)-248, February (M2)-134, March (M3)-162, April (M4)-94, May (M5)-72. These have been represented through the given pie chart. <BR> What is the central angle (to the nearest degree) of the sector corresponding to M1? by Maths experts to help you in doubts & scoring excellent marks in Class 14 exams.
Similar Questions
Knowledge Check
- Question 1 - Select One
Study the Pie chart carefully and answer the questions.
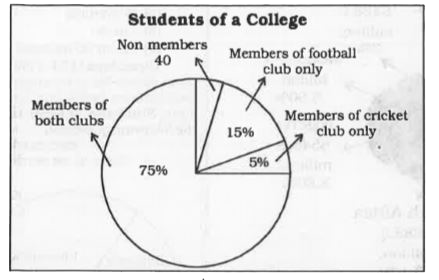
The number of students who are members of both the club is :A500B650C550D600 - Question 2 - Select One
Study the Pie chart carefully and answer the questions.
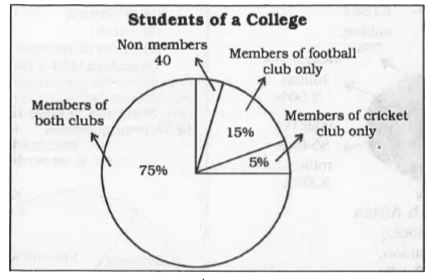
Number of students who are members of cricket club only :A35B40C42D41 - Question 3 - Select One
Study the bar chart given below and answer the following questions :
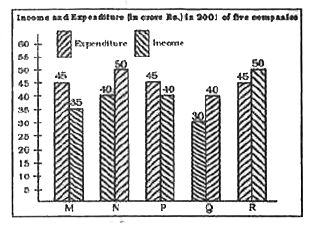
The companies M and N together had a percentage of profit/loss of :ANo loss and no profitB12% lossC10% lossD10% profit
Study the pie chart and answer the question
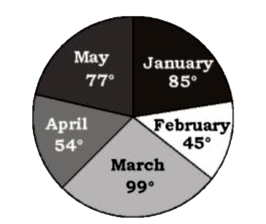
The total number of computers sold in February and April is what percentage more than the number of computers sold in MayView SolutionStudy the pie chart and answer the question

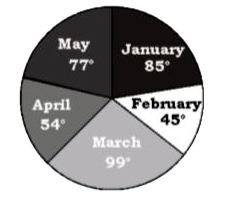
The number of months in which the number of computers sold was above 20% of the total number of computers sold in 5 months was:View SolutionStudy the pie chart given below and answer the question that follows. The total amount collected for flood relief from different sources is shown in the pie chart-

What is the approximate ratio of collection from corporates to Central Government ?View SolutionIn the following questions, study the two pie-charts and answer the questions.
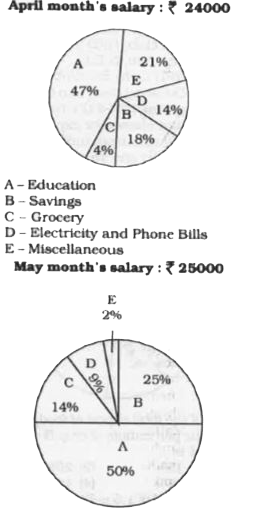
What is the percent increase in Education in May month than April month ?View SolutionStudy the following pie chart carefully and answer the questions. The pie chart represents the percentage of people involved in various occupations.

The ratio of the people involved in service to that in industry isView Solution

