Study the given graph and answer the question that follows.
Target and Actual Production of AC's (in thousands) of a factory over five months
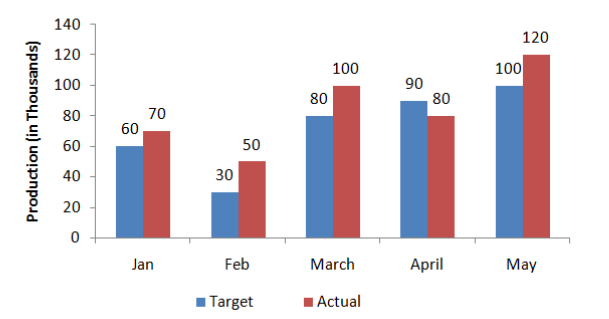
In which month is the actual production of ACs is 66% more than the target production?
April
February
March
May
The correct Answer is:B
Step by step video, text & image solution for Study the given graph and answer the question that follows. Target and Actual Production of AC's (in thousands) of a factory over five months In which month is the actual production of ACs is 66% more than the target production? by Maths experts to help you in doubts & scoring excellent marks in Class 14 exams.
Similar Questions
The bar graph given below shows the target and actual production of cement ( in thousand tons ) during 2013-2017. Out of given 5 years, in which years the target production of the cement was 45% more than the average actual production ?
नीचे दिया गया दंड आरेख 2013-2017 के दौरान सीमेंट के लक्षित और वास्तविक उत्पादन (हजार टन में) को दर्शाता है |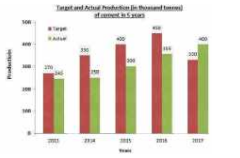
दिए गए 5 वर्षों में से किन वर्षों में सीमेंट का लक्षित उत्पादन, सीमेंट के औसत वास्तविक उत्पादन से 45% अधिक था ?View SolutionStudy the following bar diagram and answer the question that follows .
The production ( in thousands) of electronic item (TV and LCD) in a factory during the period from 2011 to 2015 .
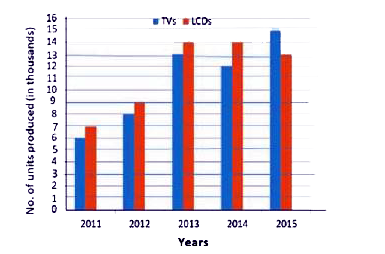
The difference between the average production of LCDs and that of TVs from 2011 to 2013 is :View Solution
Knowledge Check
- Question 1 - Select One
In which month the actual production of AC machines was 25% more than the target production?
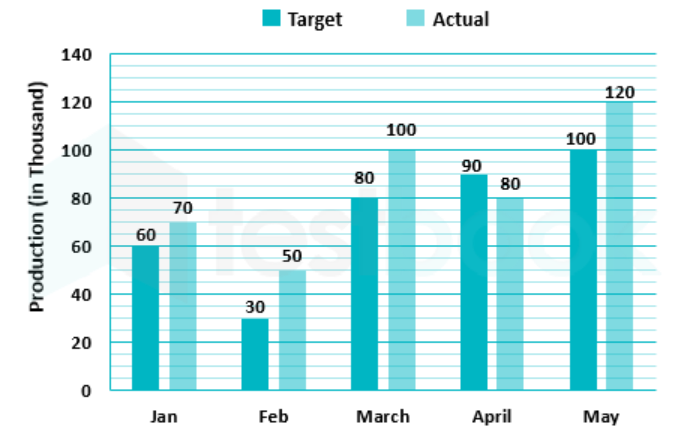 AFebruaryBMarchCJanuaryDMay
 - Question 2 - Select One
The given bar graph presents the target and actual production of AC machines of a factory over five months
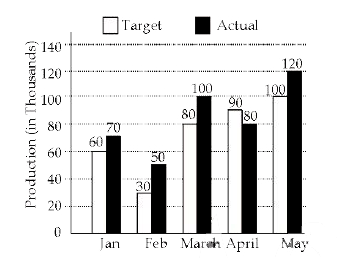
The ratio of the combined target production of AC machines in January and April to that of the combined actual production of AC Machines in March and April wasA4:5B3:2C5:6D2:3 - Question 3 - Select One
Study the following graph and answer the following questions :-
Following graph shows the actual & target productin of a companry over the period (in thousand tonnes)
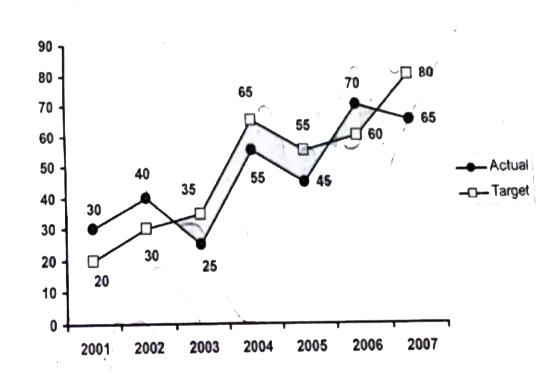
The actual production in 2005 is what percent of the target production of 2007 ?A44%B56.25%C43.75%D37.5%
Study the following bar diagram and answer the question that follows.
The production (in thousands) of electronic items (TV and LCD) in a factory during the period from 2011 to 2015.
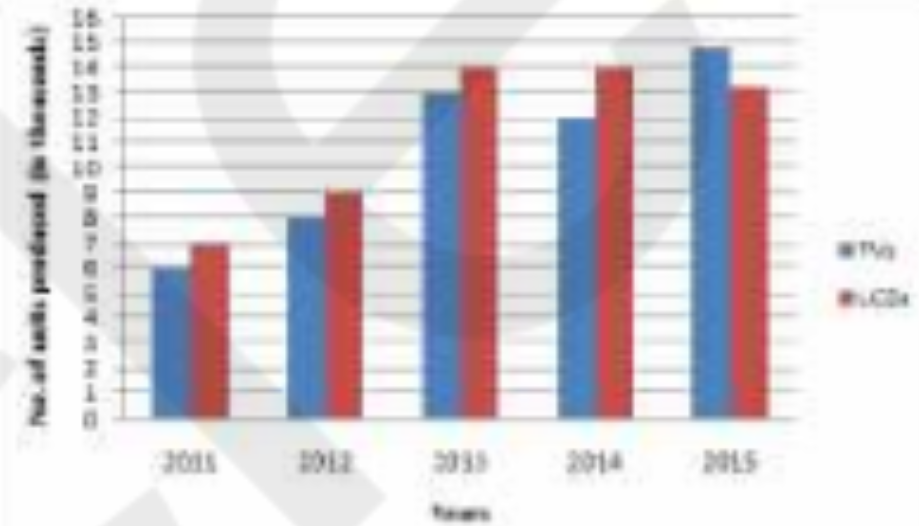 The difference between the average production of LCDs and that of the TVs from 2011 to 2013 isView Solution
Study the following graph and answer questions
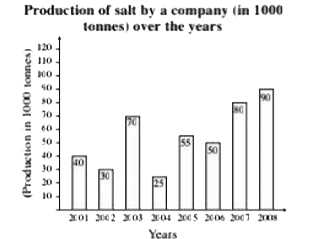
What was the percentage increase in production of salt in 2008 compared to that of 2001?View SolutionStudy the following graph and answer questions
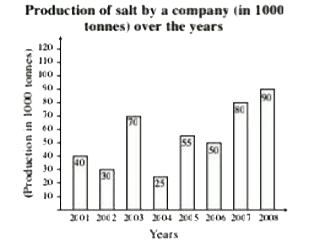
What was the percentage decline in the production of salt from 2003 to 2004 ?View SolutionStudy the graph and answer the following questions-
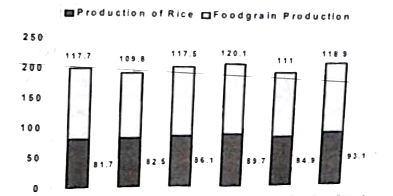
Over the given years what is average production of rice?View SolutionRead the following graph carefully and answer the questions given below.
Production of sugar in three different factories over years (in thousand tonnes)
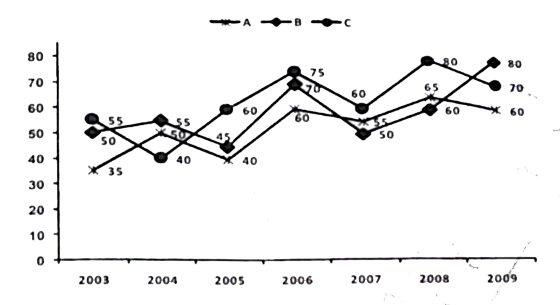
What is the average production of company C in all the years ?View Solution
