Study the following bar graph and pie-chart carefully and answer the question given below:
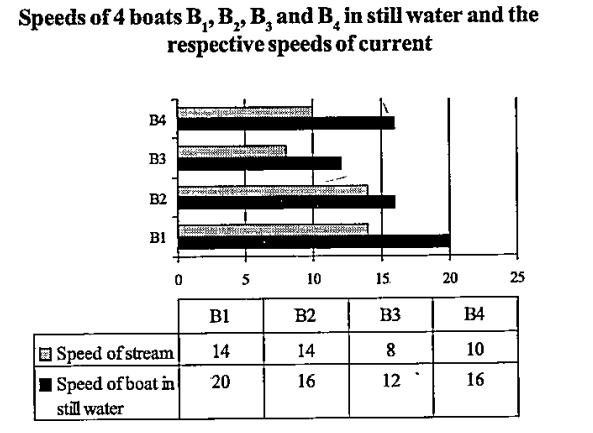
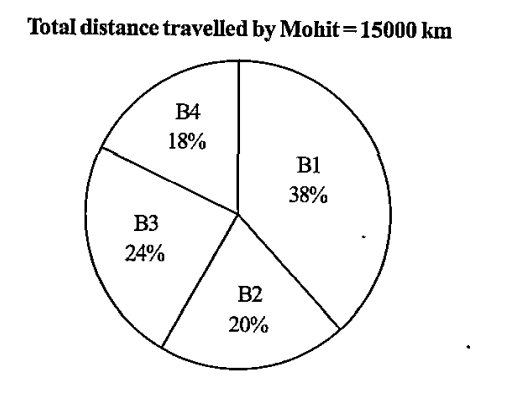
If the speed of boat B3 increases by 30% and the speed of stream decrease by 15% then what is the difference between the time taken by the boat now and that taken previously to travel 440 km? (Assume opposite direction of stream in either case).
70 hours
68 hours
60 hours
55 hours
The correct Answer is:C
Step by step video, text & image solution for Study the following bar graph and pie-chart carefully and answer the question given below: If the speed of boat B3 increases by 30% and the speed of stream decrease by 15% then what is the difference between the time taken by the boat now and that taken previously to travel 440 km? (Assume opposite direction of stream in either case). by Maths experts to help you in doubts & scoring excellent marks in Class 14 exams.
Updated on:21/07/2023Similar Questions
Study the following bar graph and answer the questions given below.
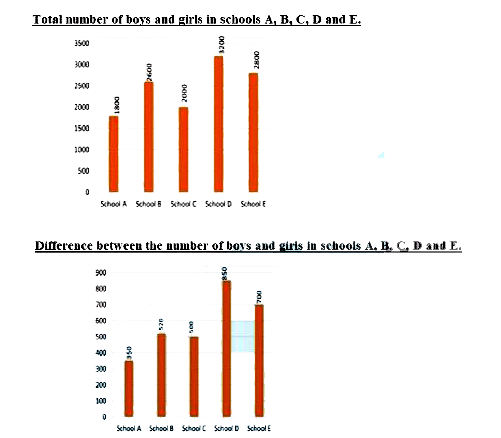
The number of boys in school B is what percentage of the total number of students in that school ?
View SolutionStudy the following pie-chart carefully and answer the questions given below :-
Survey conducted on 12000 people of various professionals and percentage of female professionals
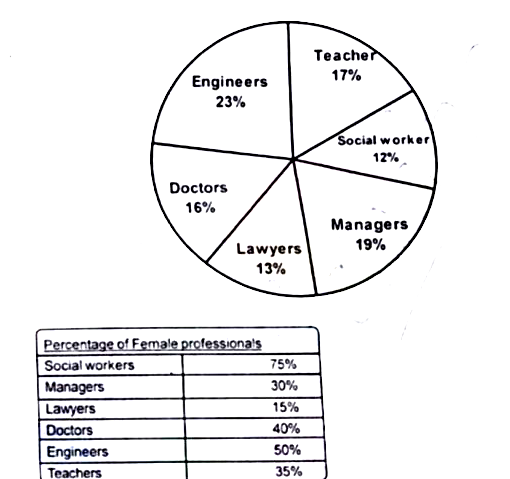
What is the difference between the total number of make and female professionals in the town ?
View Solution
Knowledge Check
Study the following graph carefully and answer the questions given below it -----
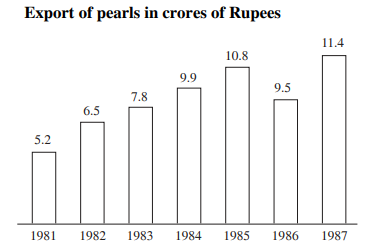
What was the percentage increase in export from 1986 to 1987 ?A1623%B20%C19%D3313%Study the following Pie-Chart carefully to answer the questions given below.
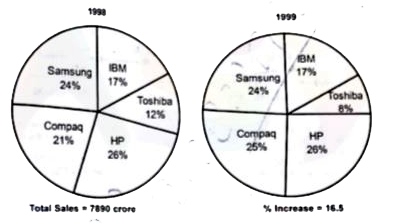
The percentage increase/decrease in the sales of Toshiba in 1999 is approximately-A0.16B0.61C0.22D0.68Study the following Pie-Chart carefully to answer the questions given below.
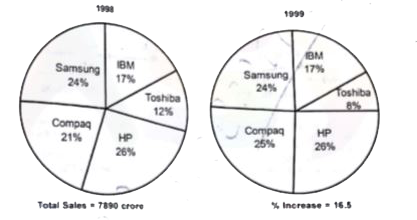
IBM's sales in 1998 is what percentage of the sales of Samsung in 1999 ?A0.4634B0.5234C0.57D0.608
Study the following graph carefully to answer these questions-
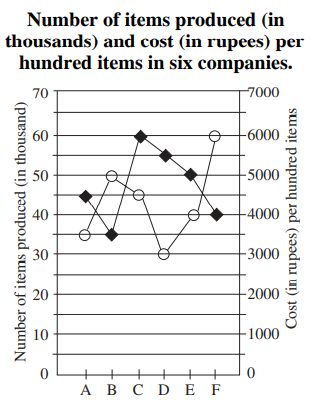
If the number of items produced by company ‘D’ increases by 30%. What will be the total cost of items produced?
View SolutionStudy the following graph carefully and answer the questions given below
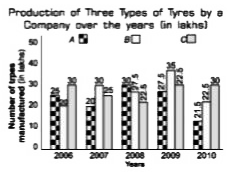
What was the difference between the number of B type tyres manufactured in 2008 and 2009?
View SolutionStudy the following graph carefully and answer the questions given below-
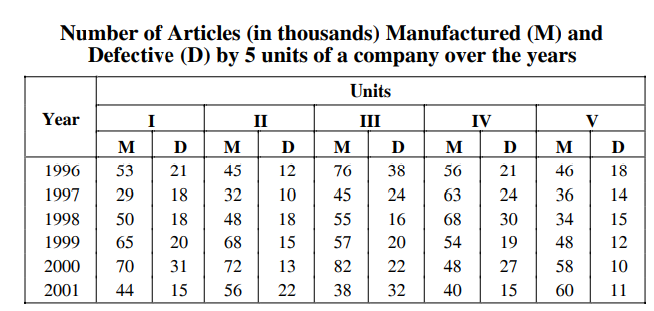
Approximately what was the percentage increase in the sale of hardware in domestic sector form 1994-95 to 1995-96?
View SolutionStudy the following graph carefully to answer the questions given below.
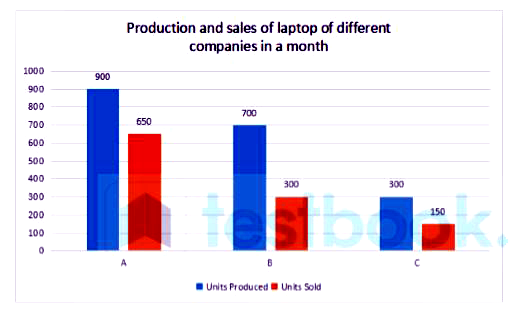
Percentage of sale of units with respect to its production is between 40% and 43%, in case of company:
View SolutionRead the following graph carefully and answer the questions given below.
Percentage of cars of 6 different models produced by a company in two years.
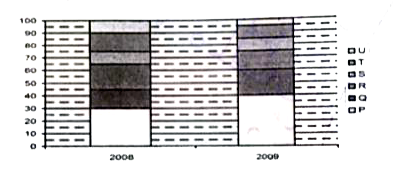
What is the difference between number of T model cars in year 2008 and 2009 ?
View Solution
