Directions: Given below table shows total three types of food items (P, Q and R) sold by a shop on five days of a week. Table also shows total type P food items sold by shop and percentage of food items Q and food items R sold by shop. Read the data carefully and answer following question
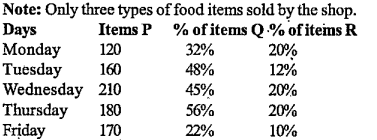
Find the ratio between total food items sold by shop on Monday to total food items sold by shop on Thursday?
1:5
1:3
1:7
1:4
The correct Answer is:B
Step by step video, text & image solution for Directions: Given below table shows total three types of food items (P, Q and R) sold by a shop on five days of a week. Table also shows total type P food items sold by shop and percentage of food items Q and food items R sold by shop. Read the data carefully and answer following question Find the ratio between total food items sold by shop on Monday to total food items sold by shop on Thursday? by Maths experts to help you in doubts & scoring excellent marks in Class 14 exams.
Updated on:21/07/2023Similar Questions
Starch in food items
View SolutionBar graph given below shows pens sold by a retailor on five different days. Study the data carefully and answer the following questions.
Pen sold on different days
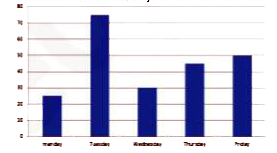
Find the difference between total number of pens sold on Monday and Tuesday together to total number of pens sold on Thursday and Friday together?
View Solution
Knowledge Check
Food items purchased by a production unit are :
ASingle use consumer goodsBDurable use consumer goodsCSingle use capital goodsDDurable use capital goods
Directions: The following table shows the number of bananas sold by 5 fruit sellers and the relation of apples with bananas in 3rd column. Read the table carefully and answer the following question.

The total fruits sold by B is approximately what percent of the total fruits sold by D?
View SolutionBar graph given below shows pens sold by a retailor on five different days. Study the data carefully and answer the following questions.
Pen sold on different days
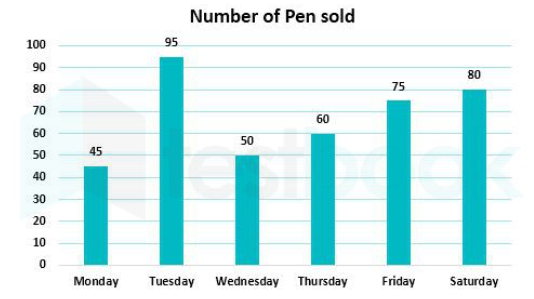
what is the average number of pens sold during a week if total number of pens sold on saturday is 25% more than total number of pens sold on Sunday .
View SolutionDirection: The given bar graph shows the number of pens sold by two shops A & B in four consecutive months. Study the following data and answer the following questions:
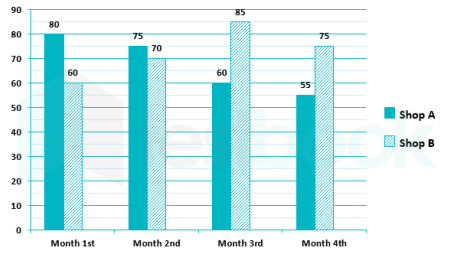
Find the ratio of the number of pens sold by shop A in 1st month to the number of pens sold by B in 3rd month.
View SolutionDirection: The given bar graph shows the number of pens sold by two shops A & B in four consecutive months. Study the following data and answer the following questions:
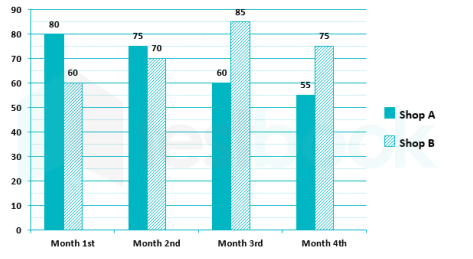
Find that the number of pens sold by shop A in 1st month is how much percent more than the number of pens sold by shop A in 3rd month.
View SolutionDirection: The given bar graph shows the number of pens sold by two shops A & B in four consecutive months. Study the following data and answer the following questions:
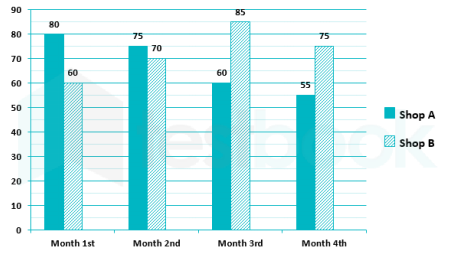
What is the difference between the number of pens sold by shop A and B together in month 3th and 4th?
View Solution
What is the difference between the total no. of shirt of all given four types sold by shopkeeper on Monday and the total no. of shorts of all the given types sold by shopkeeper on Tuesday ?
View SolutionDirection: The given bar graph shows the number of pens sold by two shops A & B in four consecutive months. Study the following data and answer the following questions:
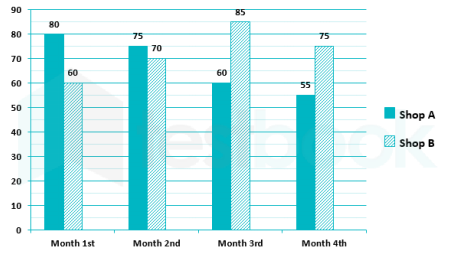
Find the ratio of the number of pens sold by shop A in months 1st and 3rd together to the number of pens sold by shop B in months 2nd and 4th together.
View Solution
