Directions: The line graph shows the number of people(Men + Women) visited five(M, N, O, P & Q) different Yoga centres and the number of women visited out of total people visited these five Yoga centres. Read the data carefully and answer the questions.
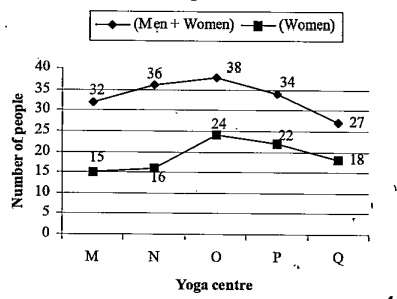
Total people (Men+Women)who visited Yoga centre N is what per cent more than total people (Men+Women)who visited Yoga centre Q(Approximately)?
25%
39%
43%
33%
The correct Answer is:B
Step by step video, text & image solution for Directions: The line graph shows the number of people(Men + Women) visited five(M, N, O, P & Q) different Yoga centres and the number of women visited out of total people visited these five Yoga centres. Read the data carefully and answer the questions.Total people (Men+Women)who visited Yoga centre N is what per cent more than total people (Men+Women)who visited Yoga centre Q(Approximately)? by Maths experts to help you in doubts & scoring excellent marks in Class 14 exams.
Similar Questions
Direction: The following line graph shows the number of Peoples who are working in certain institute and speaks four different language. Study the following data and answer the following questions:
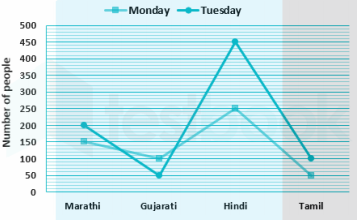
The total number of people who speaks Tamil language on both days is what approximate percent of the total number of people who speak four different languages on both days?View SolutionDirection: The following table shows the data of people of five different cities. Study the following table and answer the following questions.
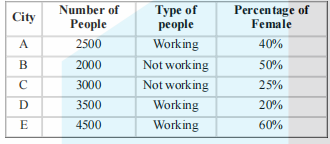
The total number of males who are working out of five cities is-View Solution
Knowledge Check
- Question 1 - Select One
The pie-chart shows the percentage-wise distribution of the number of students in five different schools P,Q,R,S and T .
The total number of students in all five schools together is 10,500 .
Study the pie -chart and answer the question .
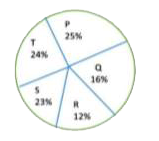
The number of students in school R is what per cent of the total number of students in schools Q and T together ?A40%B35%C25%D30% - Question 2 - Select One
The following pie chart shows the distribution of the total number of people watching five different web series
The Family Man, Scam 1992, The Hostage, The Good Doctor, and Made in Heaven. Read the pie chart carefully and answer the questions that follow
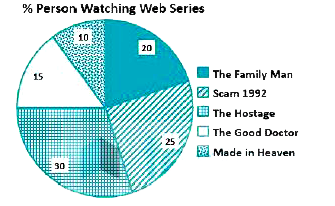
If the total number of persons watching the web series is 1000, find the difference between the number of persons watching The Hostage and The Good Doctor.A200B175C225D150
Direction: The following line graph shows the number of Peoples who are working in certain institute and speaks four different language. Study the following data and answer the following questions:
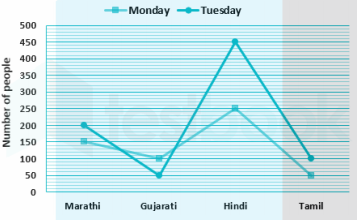
If the ratio of male and female who speaks Hindi language on Monday is 7 : 3, then the number of female who speaks Hindi on Monday is what percent of the total number of people who speaks Hindi on both days?View SolutionPercentage break up of tourist who visited across various states of India and the ratio of men to women in them. And Total number of tourists =1800
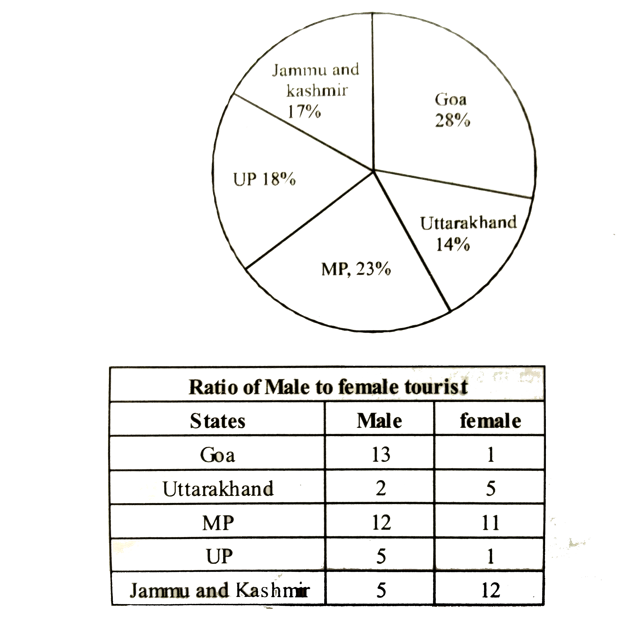
The number of female tourists who visited MP are what per cent of the total number of tourists who visited all states together ?View Solution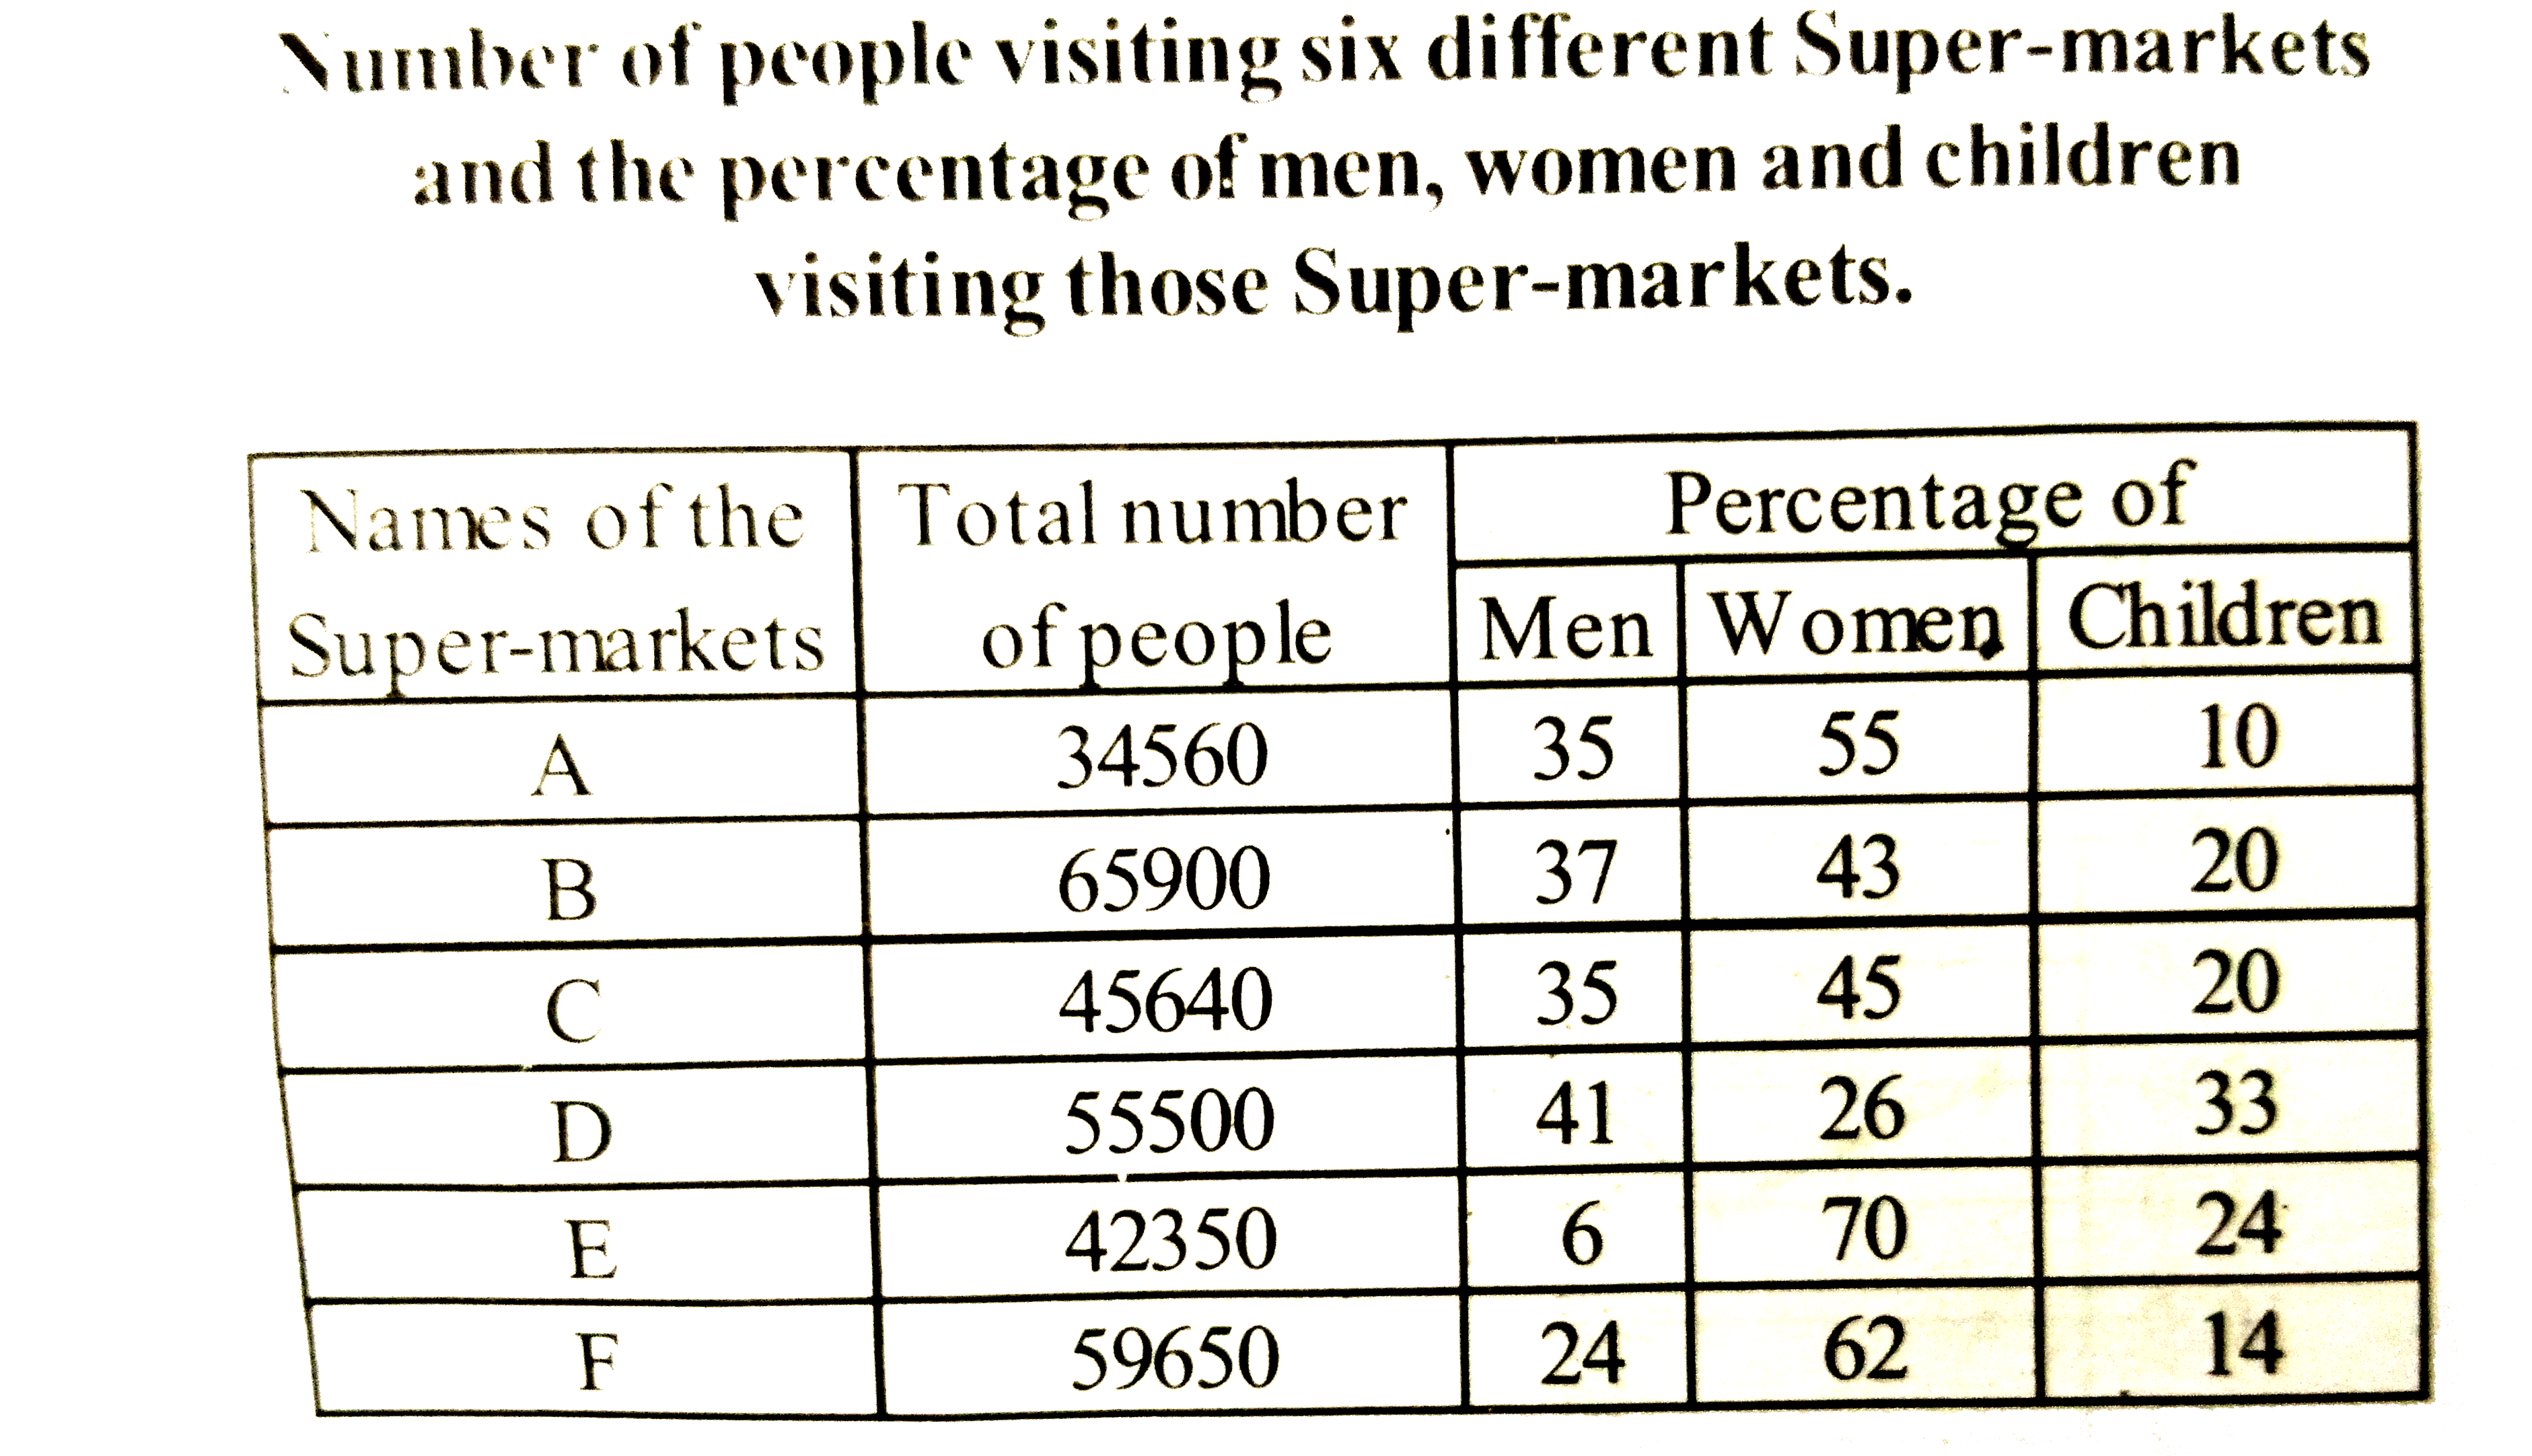
Number of men visiting Super-market D from approximtely what percent of the total number of people visiting all the Super-markets together ?View SolutionStudy the following information carefully and answer the given questions:
The diagram, given below shows the data related to loan fair. In total z number of people contacted for a loan fair, from which x number of people visited loan fair and 9600 people shown interest for a loan. Out of the total number of people shown interest for a loan only 32% applied for the loan. Out of the total number of people applied for the loan, only 20% are eligible for a loan. Out of the total number of people eligible for a loan, loan of only y% people are disbursed
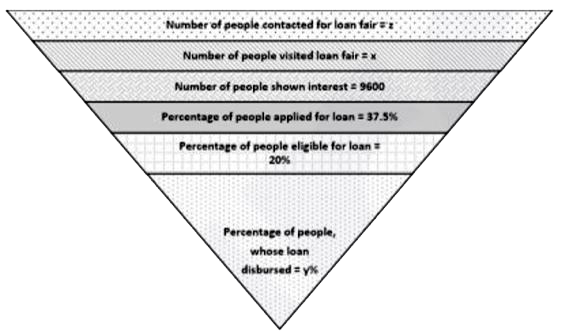
Ratio of the number of people, who did not visit the loan fair and the number of people, who visited the loan fair but not shown interest is 7 : 5 . If the total number of people contacted for the loan fair is 19200, then find the value of x.View SolutionStudy the following information carefully and answer the given questions:
The diagram, given below shows the data related to loan fair. In total z number of people contacted for a loan fair, from which x number of people visited loan fair and 9600 people shown interest for a loan. Out of the total number of people shown interest for a loan only 32% applied for the loan. Out of the total number of people applied for the loan, only 20% are eligible for a loan. Out of the total number of people eligible for a loan, loan of only y% people are disbursed
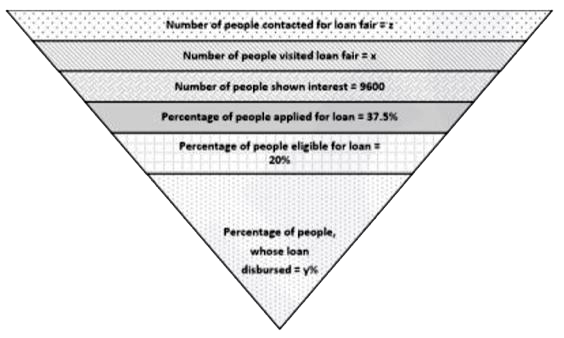
If 6000 people, who visited loan fair but not shown interest and 7400 people, who were contacted but did not visit the loan fair, then how many people contacted for the loan fair?View SolutionStudy the following information carefully and answer the given questions:
The diagram, given below shows the data related to loan fair. In total z number of people contacted for a loan fair, from which x number of people visited loan fair and 9600 people shown interest for a loan. Out of the total number of people shown interest for a loan only 32% applied for the loan. Out of the total number of people applied for the loan, only 20% are eligible for a loan. Out of the total number of people eligible for a loan, loan of only y% people are disbursed
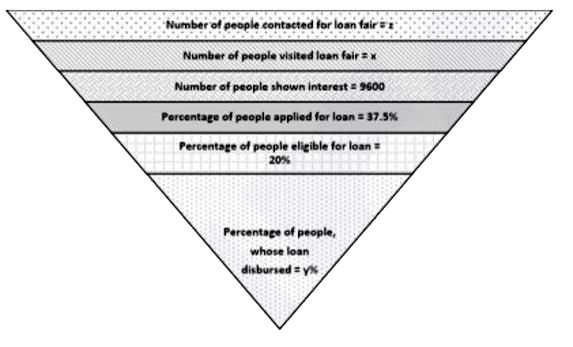
Loan of 40% of the people did not disbursed who were eligible for a loan, then find the ratio of the number of people, who shown interest and the number of people, whose loan disbursed.View Solution
