Refer to following pie chart carefully and answer the given questions: Percentage wise Distribution of a total of 1800 animals sold by a pet shop in 6 years
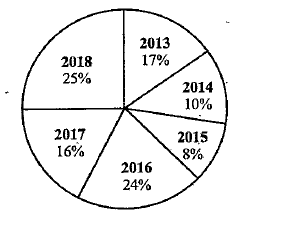
What is the average number of animals sold in the years 2016, 2017 and 2018?
390
388
394
392
The correct Answer is:A
Step by step video, text & image solution for Refer to following pie chart carefully and answer the given questions: Percentage wise Distribution of a total of 1800 animals sold by a pet shop in 6 years What is the average number of animals sold in the years 2016, 2017 and 2018? by Maths experts to help you in doubts & scoring excellent marks in Class 14 exams.
Updated on:21/07/2023Similar Questions
(Questions 5-9): Study the following pie-chart and table carefully and answer the questions given below: Percentage-wise Distribution of the Number of Mobile Phones Sold by a Shopkeeper During Six Months (FIGURE) What is the ratio of the number of mobile phones sold of Company B during July to those sold during December of the same company? (a) 119:145 (b) 116:135 (c) 119:135 (d) 119:130 (e) None of these
View SolutionDirections: Refer to the following graph and answer the given questions. Data related to the number of shoes sold by two stores (A and B )during five years:
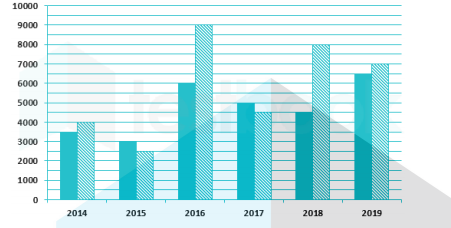
What is the difference between the total number of shoes sold by store A in 2018 and 2019 together and the total number of shoes sold by store B in 2014 and 2015 together?
View Solution
Knowledge Check
The table shows the number of cars sold by three showrooms over a period of six years.
यह तालिका तीन शोरूम द्वारा छः वर्षों की अवधि में बेची गयी कारों की संख्या दर्शाती है |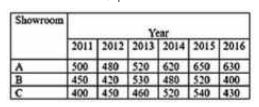 What is the average number of cars sold by showroom A over the given six years (nearest to one decimal place)?
दिए गए छः वर्षों में शोरूम A द्वारा बेची गयी कारों की औसत संख्या कितनी है ? (एक दशमलव स्थान के निकटतम )A586.7B566.7C594.7D592.7Study the following graph carefully and answer these questions :-
Expenditure and profit percent of a company in different years
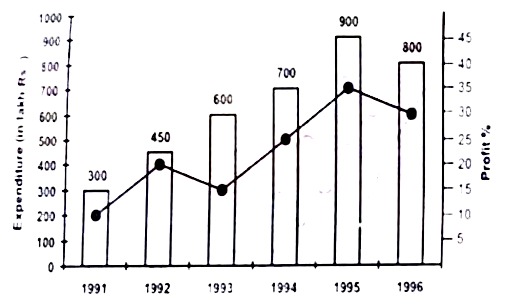
What is the average percentage profit for given years ?A24.5%B18.5%C22.5%D16.5%Study the table carefully to answer the questions that follow-
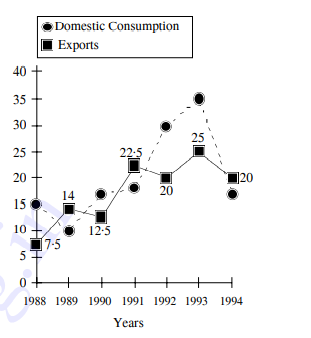
What is the approximate average number of units sold in the year 1999?A407300000B4040000C42740000D4073000000
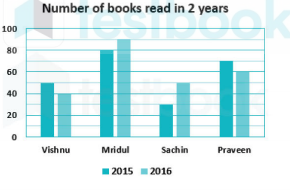
Directions: Read the bar graph carefully and answer the given questions.What is the average of total number of books read by all of them in the year 2016?
View SolutionDirections: Read the following Pie chart carefully and answer the following questions:- The pie chart shows the percentage of candidates in 6 different shifts of an examination. Total number of candidates = 5500
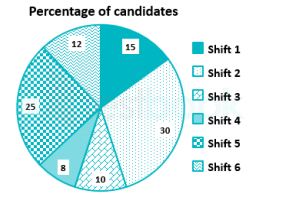
Find the average number of candidates in shift 2, shift 3 and shift 4 together in the examination.
View SolutionDirections: Refer to the following graph and answer the given questions. Data related to the number of shoes sold by two stores (A and B )during five years:
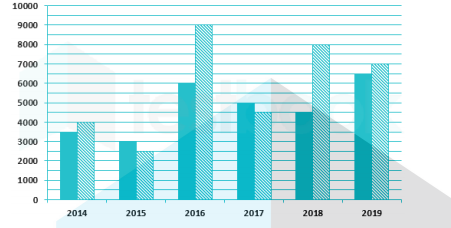
The number of shoes sold by store A decreased by what percent from 2017 to 2018?
View SolutionDirection: Study the following information carefully and answer the given questions: The following pie chart shows the percentage distribution of total number of Apples (Wet +dry)
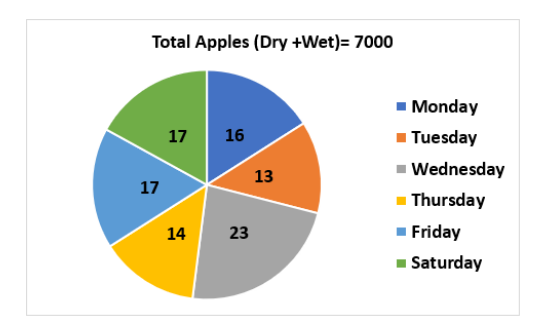
The pie chart2 shows the percentage distribution of total number of Apples (Wet) sold in different days of a week.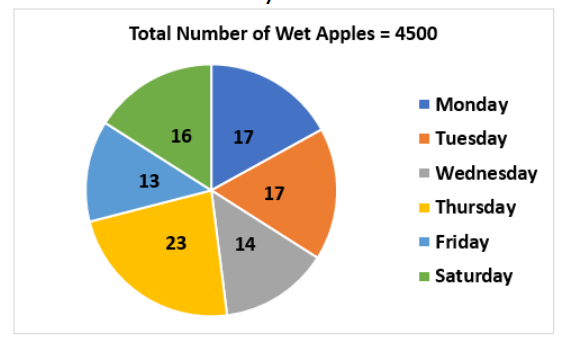
If the Apples (dry) sold on Sunday is 60 % more than the Apples (dry) sold on Saturday. Find the total Apples (dry) sold on Sunday and Saturday together?
View SolutionDirection: Study the following information carefully and answer the given questions: The following pie chart shows the percentage distribution of total number of Apples (Dry +dry)

The pie chart2 shows the percentage distribution of total number of Apples (Wet) sold in different days of a week.
What is the ratio of dry apples sold on Monday to that sold on Saturday?
View Solution