Study the bar graph and answer the given questions.
The bar graph shows the percentage growth of population in six countries in three years.
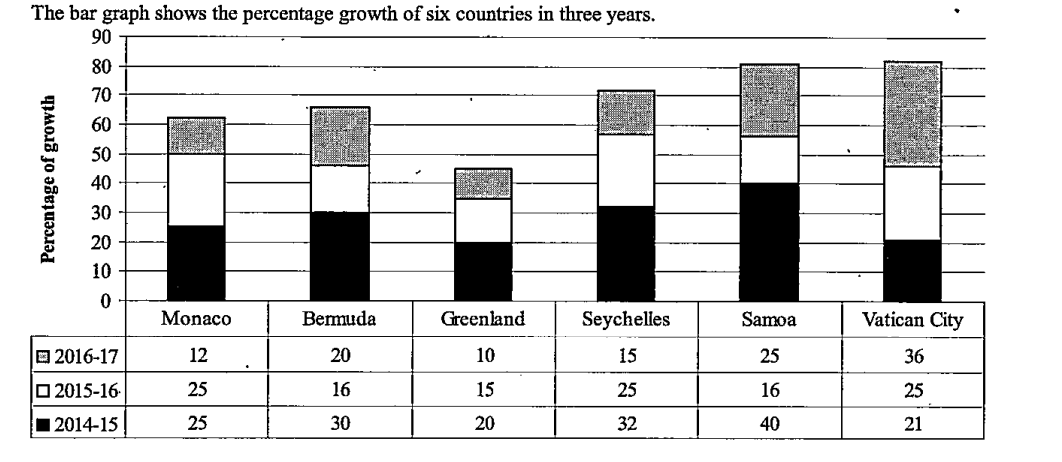
If the population of Greenland and that of Seychelles were equal in the year 2014, then what is the ratio of population of Greenland to that of Seychelles in 2016?
The correct Answer is:D
Step by step video, text & image solution for Study the bar graph and answer the given questions. The bar graph shows the percentage growth of population in six countries in three years. If the population of Greenland and that of Seychelles were equal in the year 2014, then what is the ratio of population of Greenland to that of Seychelles in 2016? by Maths experts to help you in doubts & scoring excellent marks in Class 14 exams.
Updated on:21/07/2023Similar Questions
Study the graph and answer the question
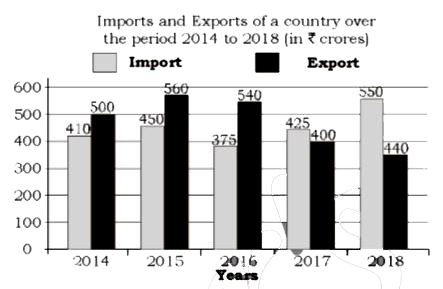
In how many years were the exports of the country more than the average imports during the given year
View SolutionRead the bar graph given below and answer the following questions.
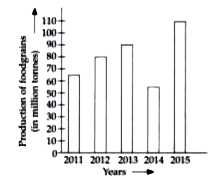
What is the ratio of the production of foodgrains in 2011 to that in 2014?
View Solution
Knowledge Check
Study the following graph carefully and answer the questions that
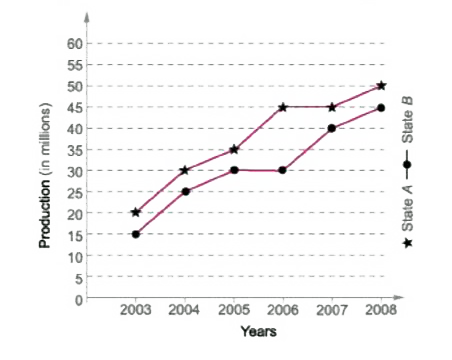
What was the average population of State B ( in millions ) for the years together ?A38.5B28.5C35D30.83Study the following graph carefully and answer the questions that
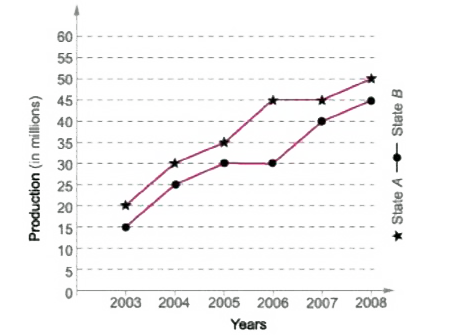
What was the percent rise in population of State A in 2007 from the previous year ?A25B3313C33DNone of theseGiven below is a bar diagram showing the percentage of Hindus, Sikhs and muslims in a state during the years 1989 to 1992.
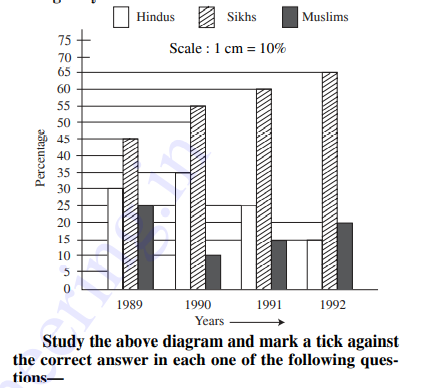
If the population of the state in 1989 be 6 lakhs, then what is the total population of hindus and muslims in this year ?A270000B3300000C330000D33000
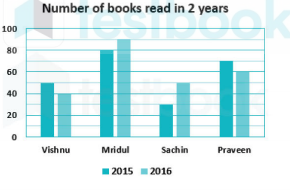
Directions: Read the bar graph carefully and answer the given questions.What is the average of total number of books read by all of them in the year 2016?
View SolutionStudy the following graph carefully and answer the given questions :-
The following graph shows the % profit of two companies over the years :-
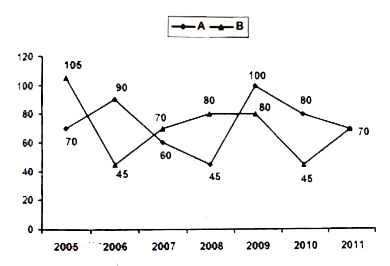
In which of the following years the ratio of expenditure to income was the least for company B?
View SolutionThe bar graph shows the population of different countries. Study the diagram and answer the following questions.
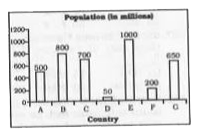
What is the ratio of population of country A to that of country G?
View SolutionStudy the following graph carefully and answer the questions that
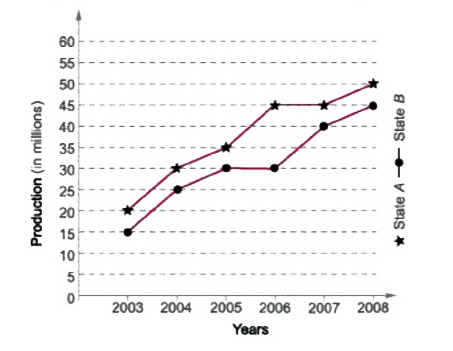
Population of State A in 2005 was what percent of its total population for all the years together ?
View SolutionStudy the following graph carefully and answer the questions that
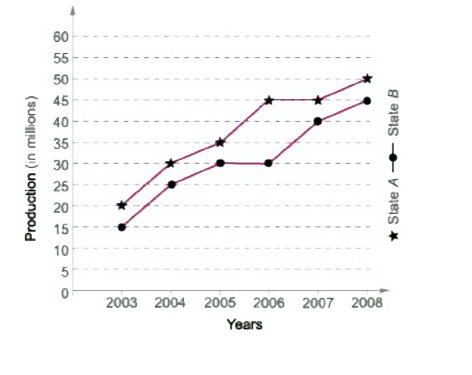
For state B , the percentage rise in population from the previous year was the highest in which of the following years ?
View Solution
