Study the bar graph and answer the given questions.
The bar graph shows the percentage growth of six countries in three years.
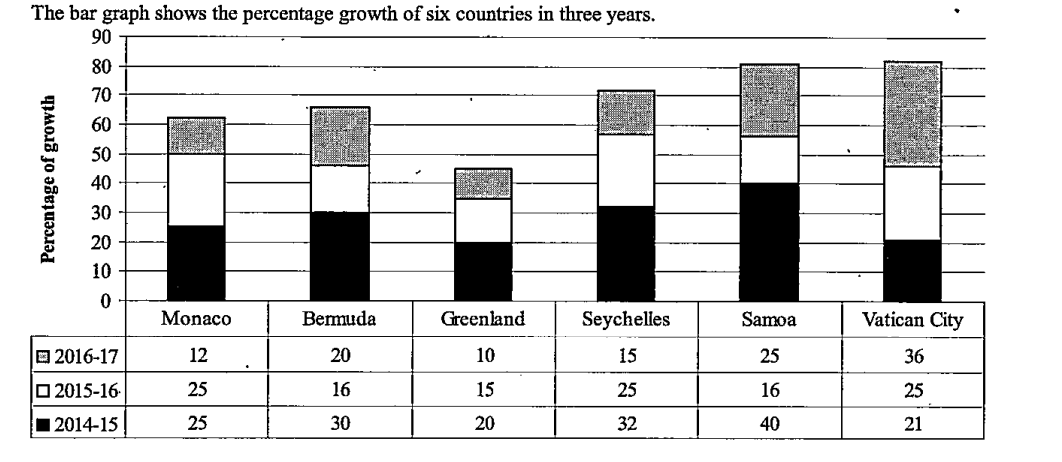
If in the year 2017, the population of Monaco and Bermuda are 1388800 and 1302912 respectively, the population of Bermuda in the year 2014 was what percentage of the population of Monaco in the year 2014?
84%
88%
95%
91%
The correct Answer is:D
Step by step video, text & image solution for Study the bar graph and answer the given questions. The bar graph shows the percentage growth of six countries in three years. If in the year 2017, the population of Monaco and Bermuda are 1388800 and 1302912 respectively, the population of Bermuda in the year 2014 was what percentage of the population of Monaco in the year 2014? by Maths experts to help you in doubts & scoring excellent marks in Class 14 exams.
Updated on:21/07/2023Similar Questions
Knowledge Check
Study the following graph carefully and answer the questions that
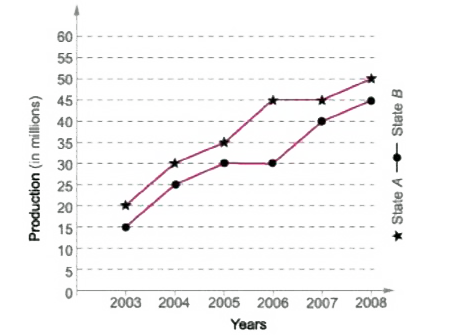
What was the percent rise in population of State A in 2007 from the previous year ?A25B3313C33DNone of theseStudy the following graph carefully and answer the questions that
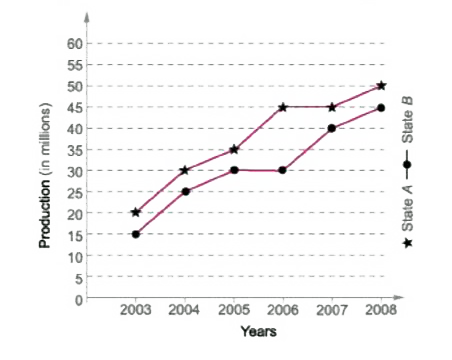
What was the average population of State B ( in millions ) for the years together ?A38.5B28.5C35D30.83Study the following graph carefully and answer the given questions :-
The following graph shows the % profit of two companies over the years :-
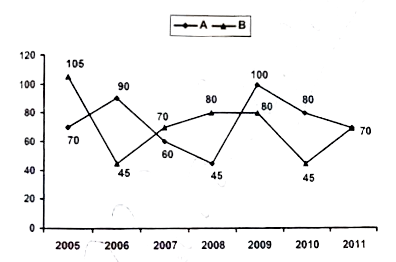
In which of the following years was the total income more than double the total expenditure in that year for company A ?A2010B2009C2006Dnone of these
Study the graph and answer question ,
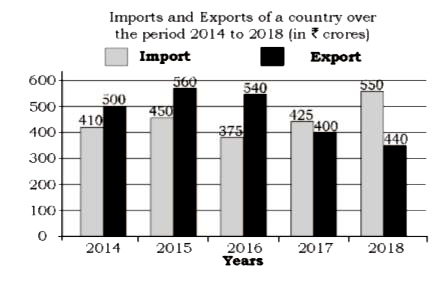
In what percentage are the total imports of the country in 2016 and 2017 less then the total exports 2014 ,2015 and 2018
View SolutionStudy the following bar graph and answer the question that follows.
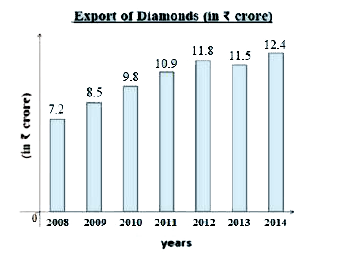
In which year was the maximum percentage increase in diamond exports compared to the previous year?
View SolutionThe population of a state is counted after every three years. It is found that population each time is increased by 20% as compared to the previous count. If the population in the year 1998 was 42 lakh. What will be the population in the year 2007?
View SolutionStudy the following Bar Graph and answer the questions. The Bar Graph gives the annual rates of inflation in percentage for 1975 and 1987.
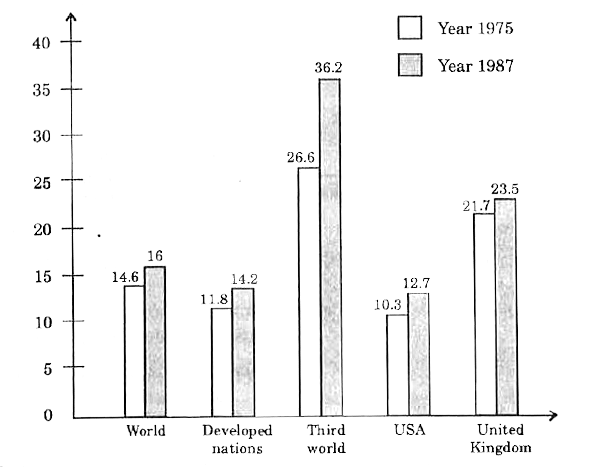
In the year 1987, the inflation rate in the third world countries vis-à-vis the world jumped approximately by
View SolutionStudy the following graph carefully and answer the questions that
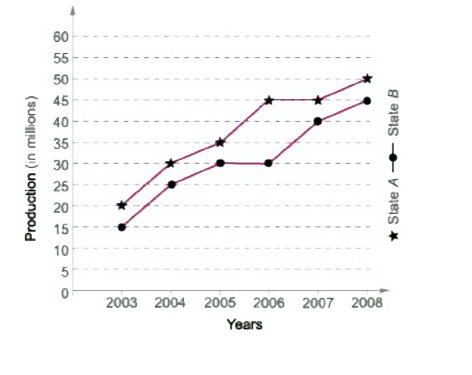
For state B , the percentage rise in population from the previous year was the highest in which of the following years ?
View Solution

