By what approximate percentage of time taken by honda car with only seat filled along route A with double traffic is less than that of hyundai car with all seats filled along route C with double traffic
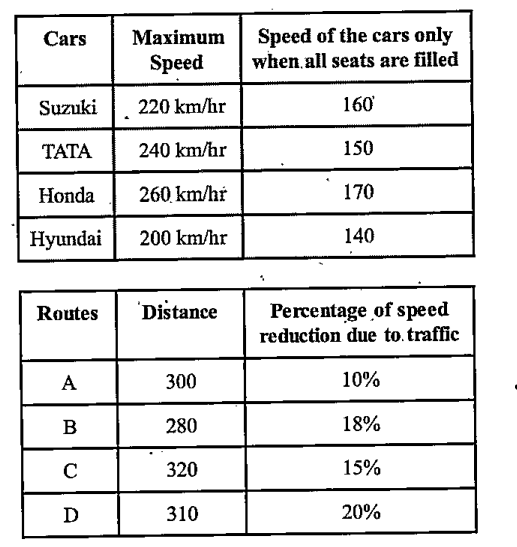
28.%
39%
33.5%
56%
The correct Answer is:D
Step by step video, text & image solution for By what approximate percentage of time taken by honda car with only seat filled along route A with double traffic is less than that of hyundai car with all seats filled along route C with double traffic by Maths experts to help you in doubts & scoring excellent marks in Class 14 exams.
Updated on:21/07/2023Similar Questions
The pie chart given below shows the percentage of time taken by different processes in making a car
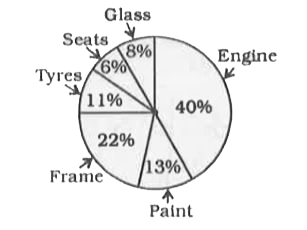
15% of total time is spent on quanlity check and this time is equalty check and this time is equally taken from all other processes . So what will be the new sectorial angle (in degrees) made by total time of seats and glass ?
View SolutionThe pie chart given below shows the percentage of time taken by different processes in making a car

time taken in seats is 192 hours , what is the time taken (in hours ) in glass ?
View Solution
Knowledge Check
The pie chart given below shows the percentage of time taken by different processes in making a car

time taken in seats is 192 hours , what is the time taken (in hours ) in glass ?A256B352C416D278The table shows the production of different types of cars
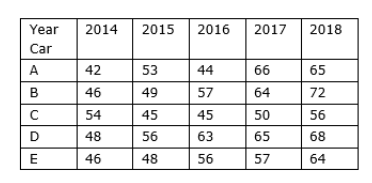
The average production of cars in 2018 is approximately what percent less than the total production of type D cars in 2015 and type b cars in 2017 taken together?A0.458B0.436C0.424D0.442The table shows the production of different types of cars (in thousands).
यह तालिका एक कंपनी द्वारा अलग-अलग कारों के उत्पादन (हज़ार में ) को दर्शाती है |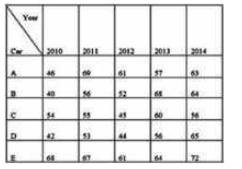 The average production of all type of cars in 2014 is approximately what percent less than the total production of type B cars in 2013 and type D cars in
2010 taken together?
2014 में सभी प्रकार की कारों का औसत उत्पादन 2013 में B प्रकार तथा 2010 में D प्रकार की कारों के कुल उत्पादन से लगभग कितना प्रतिशत कम है ?A0.418B0.449C0.432D0.444
Study the double bar graph shown below and answer the questions that follow:
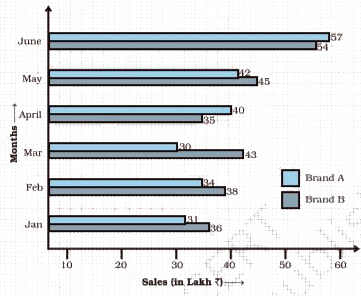
(a) What information is represented by the above double bar graph?
(b) In which month sales of Brand A decreased as compared to the previous month?
(c) What is the difference in sales of both the Brands for the month of June?
(d) Find the average sales of Brand B for the six months.
(e) List all months for which the sales of Brand B was less than that of Brand A.
(f) Find the ratio of sales of Brand A as compared to Brand B for the month of January.
View SolutionTraffic shock wave. An abrupt shlowdown in concentrated traffic can travel as a pulse, termed a shock wave, along the line of cars, either downstream ( in the traffic direction) or upstream, or it can be stationary. Figure 2-17 shows a uniformly spaced line of cars moving at speed v=25.0 m/s toward a uniformly spaced line of slow cars moving at speed vs=5.00 m/s. Assume that each faster car adds length L=12.0 m (car length plus buffer zone ) to the line of slow cars when it joins the line, and assume it slows abruptly at the last instant. (a) For what separation distance d between the faster cars does the shock wave remain stationary ? It the separation is twice that amount, what are the (b) speed and (c) direction ( upstream or downstream ) of the shock wave ?

View SolutionStudy the given information carefully and answer the questions that follow.
The table given below shows the capacity of 5 buses (A, B, C, D, E) and the percentage of seats that were filled out of the total seating capacity of the buses.
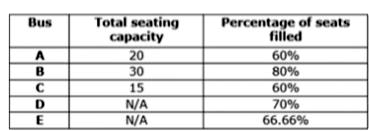
Some of the data is missing and is denoted as N/A
A) The total number fo vacant seats in all the 5 nuses together were 40
B) The number of seats in buses D and E together were 65
What is the ratio of the number of filled seats of bus B and the vacant seats of bus A?
View SolutionStudy the given information carefully and answer the questions that follow.
The table given below shows the capacity of 5 buses (A, B, C, D, E) and the percentage of seats that were filled out of the total seating capacity of the buses.
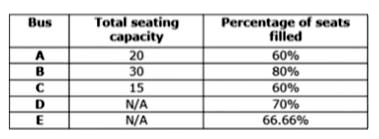
Some of the data is missing and is denoted as N/A
A) The total number fo vacant seats in all the 5 buses together were 40
B) The number of seats in buses D and E together were 65
What is the average of the vacant seats of buses B, C, D and E?
View SolutionStudy the given information carefully and answer the questions that follow.
The table given below shows the capacity of 5 buses (A, B, C, D, E) and the percentage of seats that were filled out of the total seating capacity of the buses.
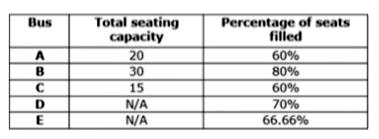
Some of the data is missing and is denoted as N/A
A) The total number fo vacant seats in all the 5 nuses together were 40
B) The number of seats in buses D and E together were 65
What was the difference between the number of vacant seats in Bus C and the number of filled seats in Bus D?
View Solution
