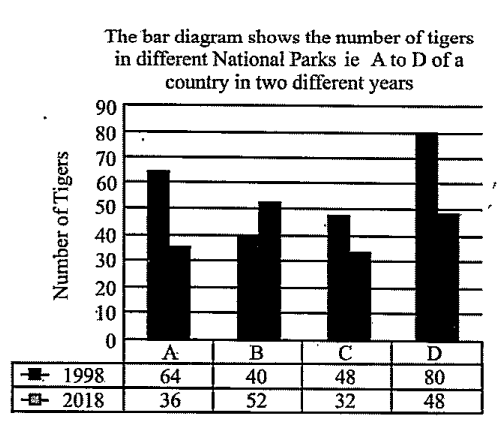
Read the following bar graph carefully and answer the question given below it.

The number of tigers in National Park E in 2018 is 40% more than the number of tigers in National Park D in 1998 while the number of tigers in National park E in 1998 was 25% less than the number of tigers in National Park C in 2018. Find total number of tigers in National park E in 1998 and 2018 together?
148
84
172
136
The correct Answer is:D
Step by step video, text & image solution for Read the following bar graph carefully and answer the question given below it. The number of tigers in National Park E in 2018 is 40% more than the number of tigers in National Park D in 1998 while the number of tigers in National park E in 1998 was 25% less than the number of tigers in National Park C in 2018. Find total number of tigers in National park E in 1998 and 2018 together? by Maths experts to help you in doubts & scoring excellent marks in Class 14 exams.
Updated on:21/07/2023Similar Questions

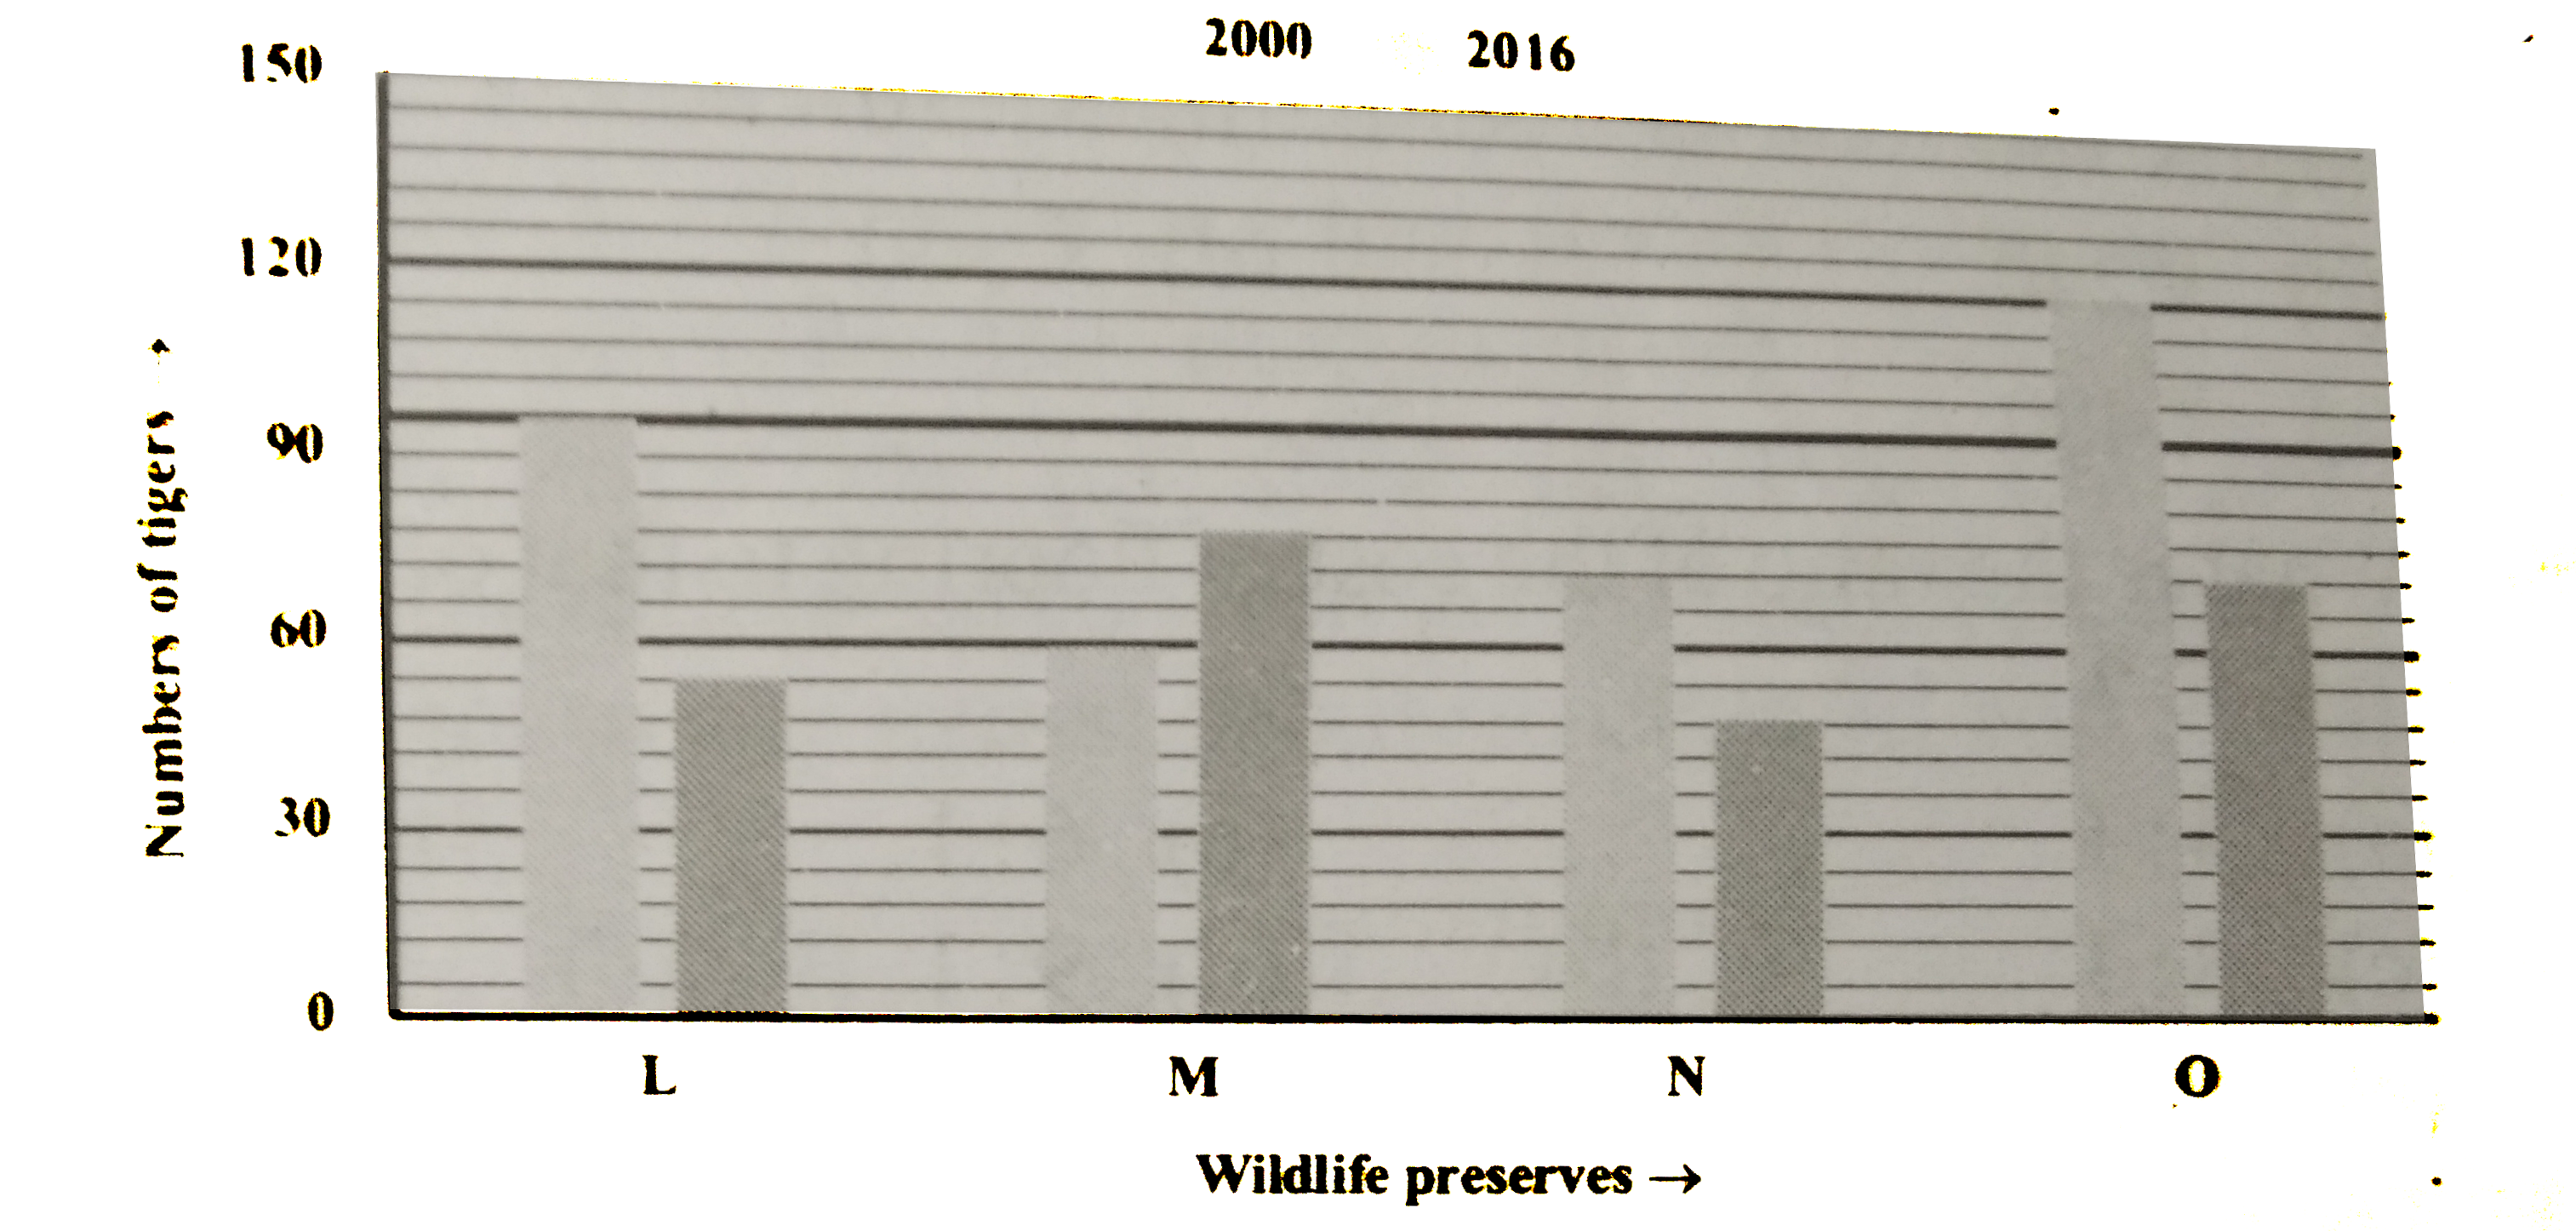
Number of tigers in Wildlife preserve 'P' in 2016 is 40% more than number of tigersin Wildlife preserve 'O' in 2000 while number of tigersin Wildlife preserve 'P' in 2000 is 25% less thn number of tigers in Wildlife preserve 'N' in 2016. find total number of tigers in Wildlife preserve 'P' in 2000 and 2016 together ?
View SolutionWhat is a national park?
View Solution
Knowledge Check
Nokrek National Park is in
ANagalandBMeghalayaCWest BengalDAssamDudhwa National Park is located in
AOdishaBGujaratCUttar PradeshDHimachal PradeshPeriyar National Park is in_____ .
ATamil NaduBGoaCKarnataka4DKerala
