Study the line graph carefully and answer the questions given below:

What is the ratio of total number of products in store Q in year 2002 and 2003 together to total number of products in store Q in the year 2000?
23:12
23:11
28:11
None of these
The correct Answer is:C
Step by step video, text & image solution for Study the line graph carefully and answer the questions given below: What is the ratio of total number of products in store Q in year 2002 and 2003 together to total number of products in store Q in the year 2000? by Maths experts to help you in doubts & scoring excellent marks in Class 14 exams.
Updated on:21/07/2023Similar Questions
Read the following graph carefully and answer the questions given below:

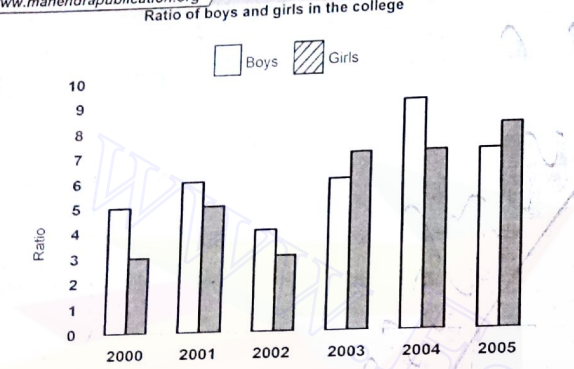
What is the respective ratio of number of boys in the year 2003 and that of girls in the year 2005 ?
View SolutionStudy the following graph carefully and answer the questions that follow
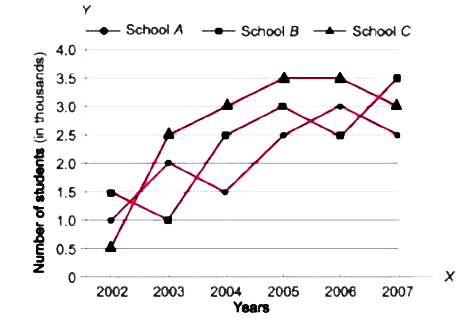
What was the average number of students in all schools together in the year 2006 ?
View SolutionStudy the following graph carefully and answer the question given below.
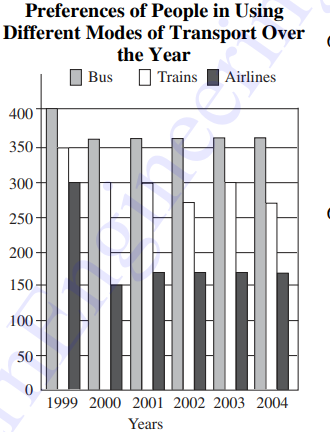
What is the respective the number of people preferring to travel by bus to the number of people preferring to travel by train in the year 2002?
View SolutionStudy the following graph carefully to answer the questions given below.
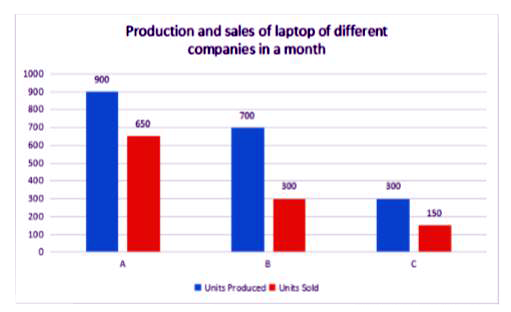
What is the average number of Units produced by all the Companies together?
View SolutionStudy the given graph carefully and answer the following questions.
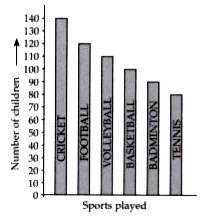
What fraction of the total number of children plays football ?
View SolutionStudy the following graph carefully to answer the questions that follow-----
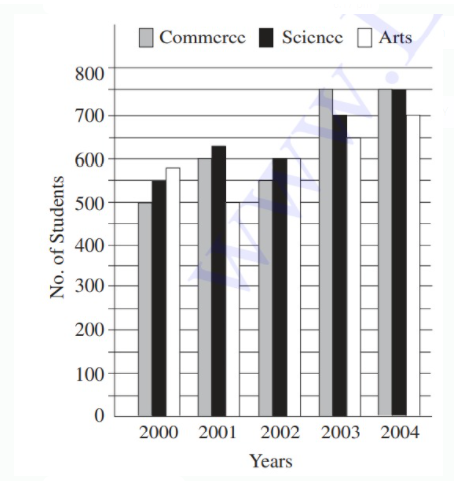
What is the total number of students studying Arts in all the years together ?
View SolutionStudy the following graph carefully and answer the questions that follow
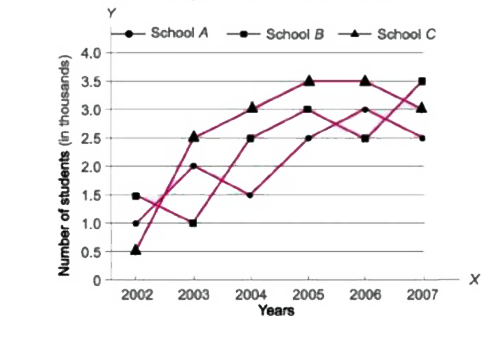
What was the difference between the total number of students in all schools together in the year 2003 and the number of students in school B in the year 2005 ?
View SolutionStudy the following graph carefully and answer the given questions.
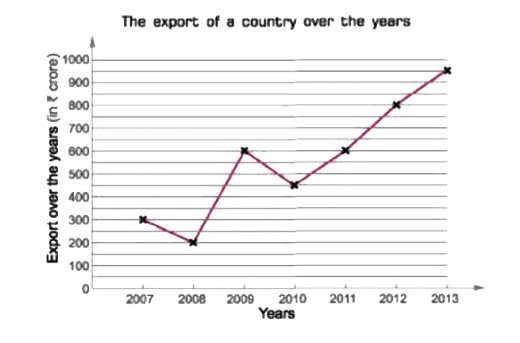
What is the total exports ( in ? Crore) for the given years ?
View SolutionStudy the following graph and answer the questions given below it.
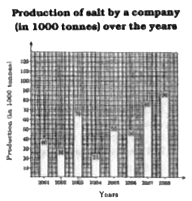
What was the percentage decline in the product of salt from 2003 to 2004 ?
View SolutionStudy the following graph carefully and answer the questions that
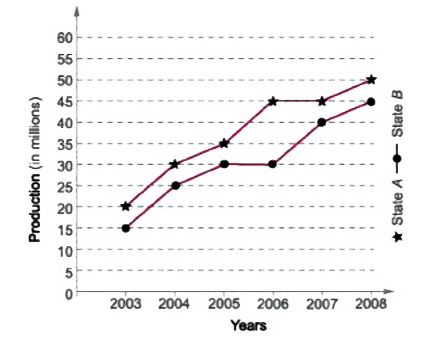
What was the ratio of the total population of State A to that of State B , for all the years together ?
View Solution
