Refer to the graph and answer the given question:
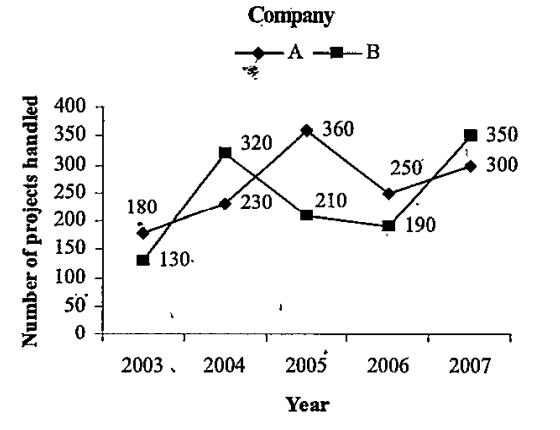
The number of projects handled by Company B decreased by what per cent from 2004 to 2006 ?
The correct Answer is:D
Step by step video, text & image solution for Refer to the graph and answer the given question: The number of projects handled by Company B decreased by what per cent from 2004 to 2006 ? by Maths experts to help you in doubts & scoring excellent marks in Class 14 exams.
Updated on:21/07/2023Similar Questions
Directions: Refer to the following graph and answer the given questions. Data related to the number of shoes sold by two stores (A and B )during five years:
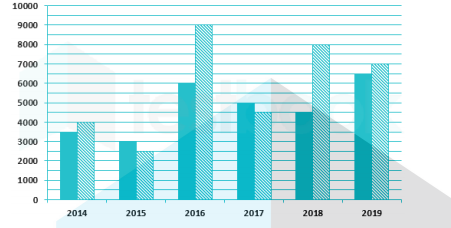
The number of shoes sold by store A decreased by what percent from 2017 to 2018?
View SolutionStudy the following graph and answer the questions given below it.
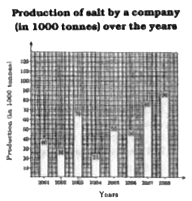
What was the percentage decline in the product of salt from 2003 to 2004 ?
View Solution
Knowledge Check
Study the given graph and answer the questopm the follows
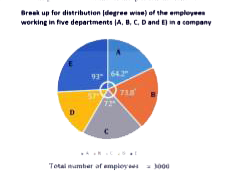
The number of employees in department B is what per cent of the total number of employees woking departments D and E ?A48.6B45.8C50.4D49.2Study the following graph which shows the production (in thousand) of different items, and answer the questions.
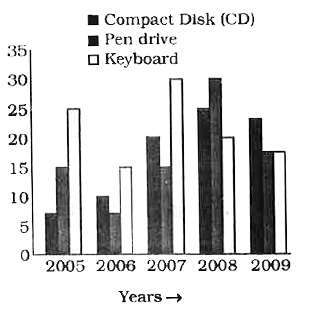
The total number of all products produced by the company in the year 2006 and 2008 together isA107500B105700C10750D1075Study the following graph carefully and answer the questions that follow
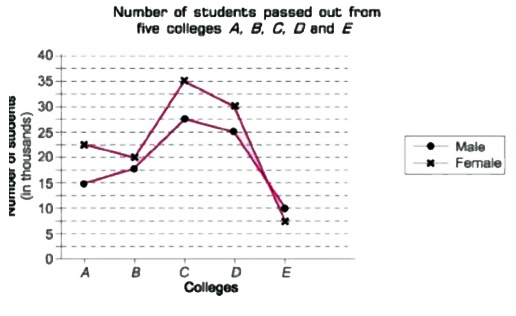
The number of females passed out from college C is approximately what per cent of the total number of females passed out from all the colleges together ?A28B30C36D25
Study the following graph carefully and answer the given questions.
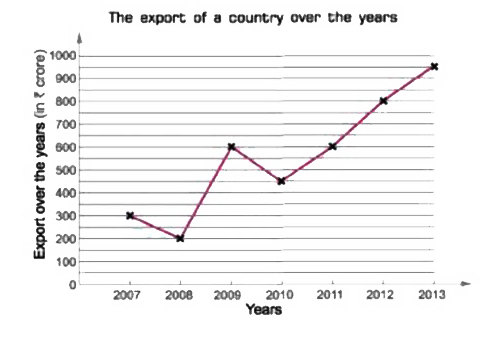
Exports in 2009 is approximately what per cent of that of year 2010 ?
View SolutionThe line graph shows the Sales per employee of a certain company. Study the diagram and answer the following questions.
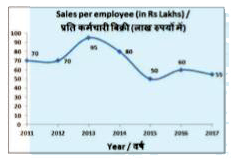
If the number of employees of the company was 80 in the year 2015 then what was the sales (in Rs crore) of the company in the year 2015?
View SolutionThe following graph shows the production of wheat flour (in 1000 tonnes) by three companies X, Y and Z over the years. Study the graph and answer the questions.
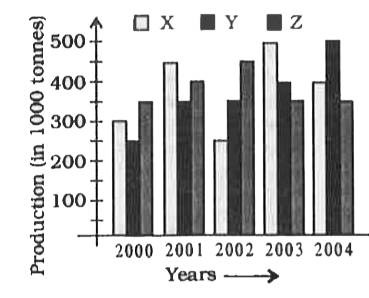
What is the ratio of the average production of company X in the period 2002-2004 to the average production of company Y in the same period ?
View SolutionThe graph shows Income and Expenditure of a company. Study the graph and answer the questions.
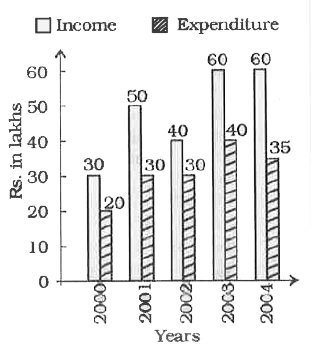
The number of years in which the income exceeds the average income is
View SolutionThe following graph shows the production of wheat flour (in 1000 tonnes) by three companies X, Y and Z over the years. Study the graph and answer the questions.
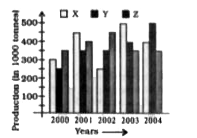
What is the ratio of the average production of company X in the period 2002-2004 to the average production of company Y in the same period ?
View Solution