Refer to the graph and answer the given question:
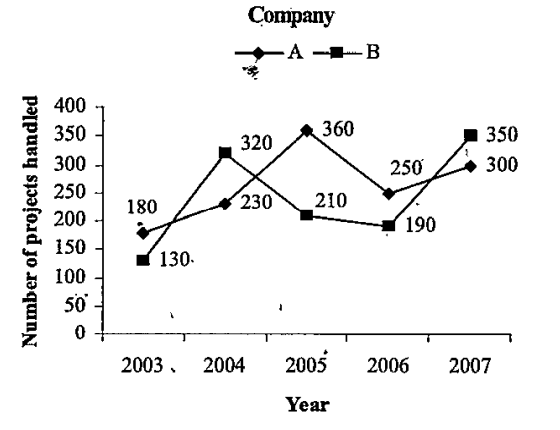
The project handled by a company can be broadly classified into types – Government projects and Non-government projects. If the average number of non-government projects handled by Company B in 2003 and 2004 is 127 then what is the total number of government projects handled by the same company in 2003 and 2004 together?
204
188
192
196
The correct Answer is:D
Step by step video, text & image solution for Refer to the graph and answer the given question: The project handled by a company can be broadly classified into types – Government projects and Non-government projects. If the average number of non-government projects handled by Company B in 2003 and 2004 is 127 then what is the total number of government projects handled by the same company in 2003 and 2004 together? by Maths experts to help you in doubts & scoring excellent marks in Class 14 exams.
Updated on:21/07/2023Similar Questions
Directions: Refer to the following graph and answer the given questions. Data related to the number of shoes sold by two stores (A and B )during five years:
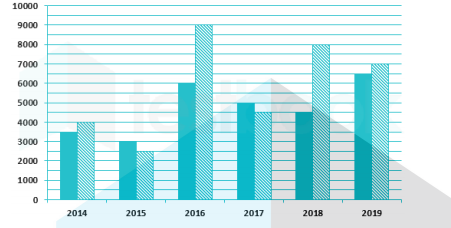
What is the difference between the total number of shoes sold by store A in 2018 and 2019 together and the total number of shoes sold by store B in 2014 and 2015 together?
View SolutionStudy the following graph carefully and answer the question given below it.
Production and sale of printers of various companies in a month.
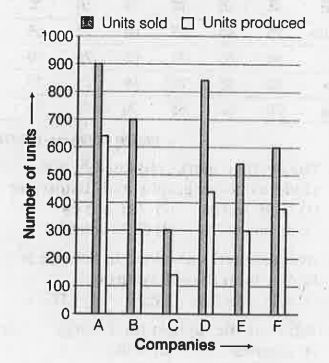
What is the average number of units produced by all the companies together?
View Solution
Knowledge Check
Study the following graph carefully to answer the questions given below.
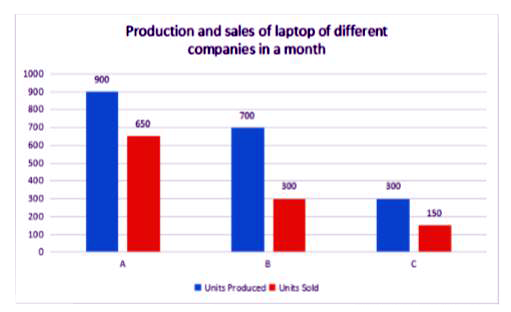
What is the average number of Units produced by all the Companies together?A62513B63313C63323D62313Read the following graph carefully and answer the questions given below.
Production of sugar in three different factories over years (in thousand tonnes)
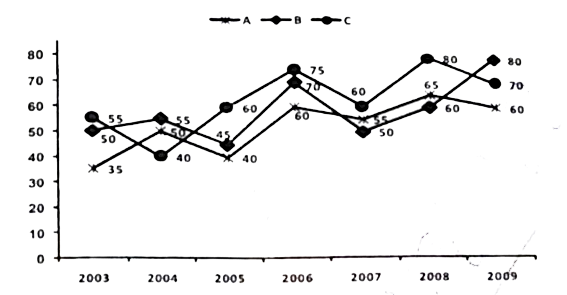
The total production of company B in 2004 and 2006 is what percent of total production of company C in 2006 and 2008 ?A30B98C56D81Study the following graph carefully to answer these questions-
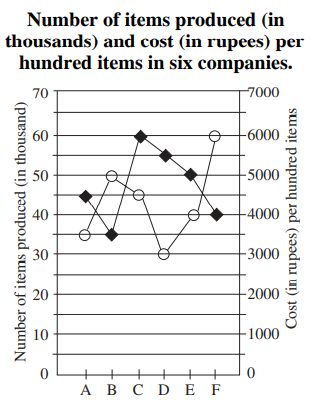
If the number of items produced by company ‘D’ increases by 30%. What will be the total cost of items produced?ARs. 21⋅45 lakhsBRs. 22⋅45 lakhsCRs. 24⋅25 lakhsDRs. 22⋅25 lakhs
The table given below shows production of five types of cars by a company from the 1998 to 2003. Study the table and answer the questions.
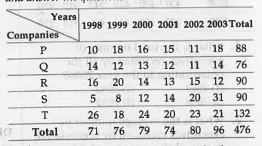
What is the ratio of total number of cars produced by all the companies together in the years 2003 and 1999?
View SolutionRead the following bar graph (Figure) and answer the following questions: What is the information given by the bar graph? State each of the following whether true or false. The number of government companies in 1957 is that of 1982 is 1:9. The number of government companies have decreased over the year 1957 to 1983.
View SolutionStudy the following graph carefully to answer the questions given below. Expenditure in lakhs) of three different Companies in Five Different Years
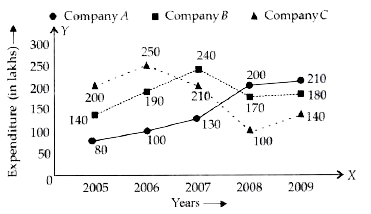
What was the difference between the total expenditure of Company B in the year 2006 and 2008 together and the total expenditure of Company C in the year 2007 and 2009 together?
View SolutionStudy the following graph carefully to answer these questions.
Profit percent Earned by Two companies Producing Electronic Goods over the Years
Profit % = Profit Earned Total Investment×100
Profit Earned = Total Income - Total Invesment in the year
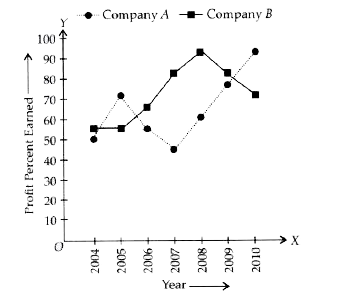
If the amount invested by Comapany B in 2004 was rupes 12 lakhs and the income of 2004 is equal to the investment is 2005, what was the amount of profit earned in 2005 by Company B?
View SolutionStudy the following graph carefully and answer the question given below.
The graph gives the three types of mobile phones manufactured by a company over the years.
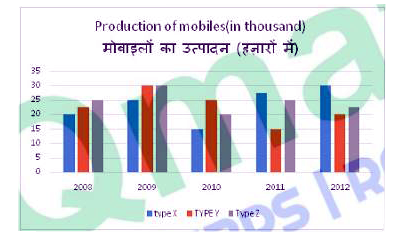
What is the percentage drop in the number of Z type mobiles manufactured from 2009 to 2010 ?
View Solution
