Refer the pie charts and answer the given question
First pie chart shows distribution of total students out of 1500 and second pie chart shows distribution of girls out of 700 in year 2009
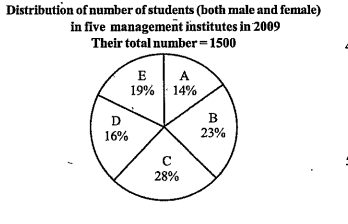
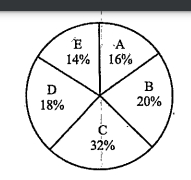
What is the difference between total number of female students in institutes A and E together and number of students (both male and female) in institute B?
135
133
145
142
The correct Answer is:A
Step by step video, text & image solution for Refer the pie charts and answer the given question First pie chart shows distribution of total students out of 1500 and second pie chart shows distribution of girls out of 700 in year 2009 What is the difference between total number of female students in institutes A and E together and number of students (both male and female) in institute B? by Maths experts to help you in doubts & scoring excellent marks in Class 14 exams.
Updated on:21/07/2023Similar Questions
The pie chart given below shows the number of students in 6 different sections. The total number of students is 1800.
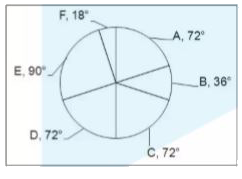
What is the difference between the number of students in section F to the number of students in section C?
View SolutionThe pie chart shows percentage wise distribution of teachers who teach six different subjects. Study the pie chart and answer the question.
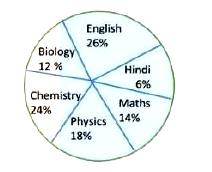
Total number of teachers = 1650
What is the difference between the total number of teachers who teach Physics and Maths and the total number of teachers who teach chemistry and biology?
View Solution
Knowledge Check
The given pie-chart depicts the percentage of students coming to school using different modes of transport. Total number of students=1300
दिया गया पाई चार्ट परिवहन के विभिन्न साधनों का प्रयोग करके विद्यालय आने वाले छात्रों का प्रतिशत दर्शाता है | छात्रों की कुल संख्या =1300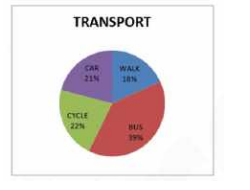 In the given pie-chart, the difference between the number of students travel by bus or walk to the number of students travel by car or cycle,
इस पाई चार्ट के अनुसार बस सेया पैदल यात्रा करने वाले छात्रों की संख्या एवं कार अथवा साइकिल से यात्रा करने वाले छात्रों की संख्या में क्या अंतर है ?A182B364C125D142The pie chart given below shows the number of students in 5 sections .The number of students is 7200.
What is the difference between the number of students in section C and section D?
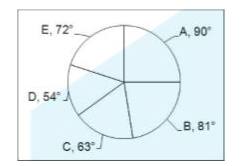 Aa)86Bb)180Cc)196Dd)42
The pie chart given below shows the distribution of students who like the given 5 sports. The total number of students is 960.
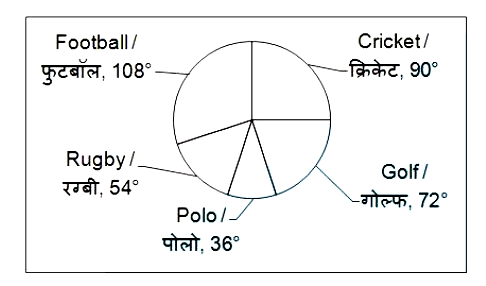
What is the difference between the number of students who like Cricket and those who like Golf?A72B50C48D90
The pie chart given below shows the number of students in 6 different sections. The total number of students is 1800.
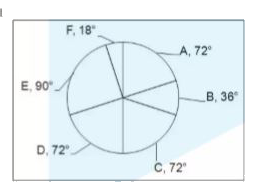
What is the total number of students in section E, C and F?
View Solutionthe pie chart given below shows the distribution of students who like the given 5 sports. . The total number of students is 960.
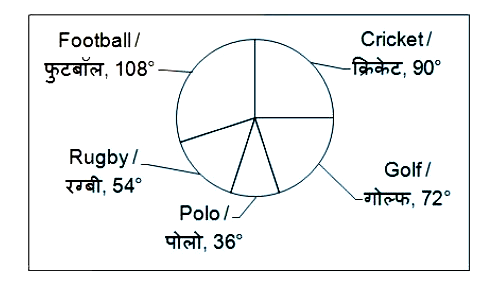
What is the average number of students who like Golf and Cricket?
View SolutionThe pie-chart shows percentage wise distribution of teachers who teach six different subjects. Study the pie chart and answer the question :
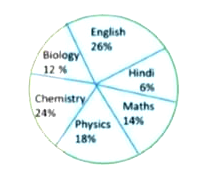
Total number of teachers =1650
What is the difference between the total number of teachers who teach Physics and Maths and the total number of teachers who tech chemistry and biology ?
View SolutionThe pie chart given below shows the number of students in 5 sections .The number of students is 7200.
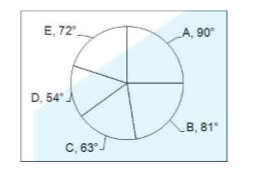
What is the total number of students in section E and section B?
View SolutionThe following pie chart shows the hourly distribution of all the major activities of a student.
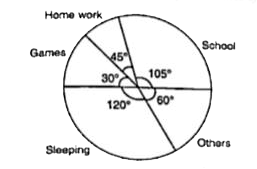
What is the difference in time (in hours) spends in school and in home work :
View Solution
