Refer to the pie chart and answer the given question.
Distribution of the total number of MRI done by five
labs in week I of April 2017
Total number=200
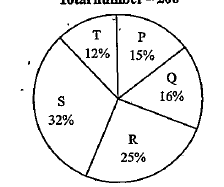
What is the difference between the total number of MRIs done by Lab P and Q together and that done by Lab S and T together?
20
26
28
22
The correct Answer is:B
Step by step video, text & image solution for Refer to the pie chart and answer the given question. Distribution of the total number of MRI done by five labs in week I of April 2017 Total number=200 What is the difference between the total number of MRIs done by Lab P and Q together and that done by Lab S and T together? by Maths experts to help you in doubts & scoring excellent marks in Class 14 exams.
Updated on:21/07/2023Similar Questions
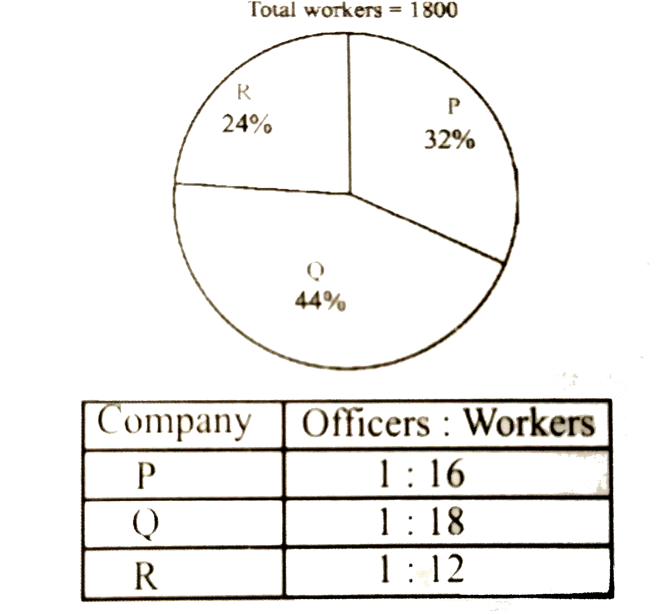
Find the difference between total number of workers in company 'P' and total number of workers in company 'Q' and 'R' together ?
View SolutionDirections: Refer to the following graph and answer the given questions. Data related to the number of shoes sold by two stores (A and B )during five years:
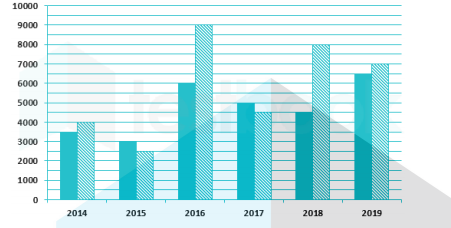
What is the difference between the total number of shoes sold by store A in 2018 and 2019 together and the total number of shoes sold by store B in 2014 and 2015 together?
View Solution
Knowledge Check
What is the difference between the total number of men and the total number of women workingin night shifts from all the industries together?
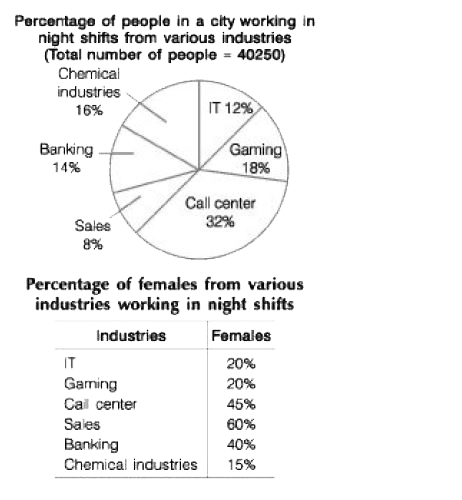 A13254B13542C13524D13363
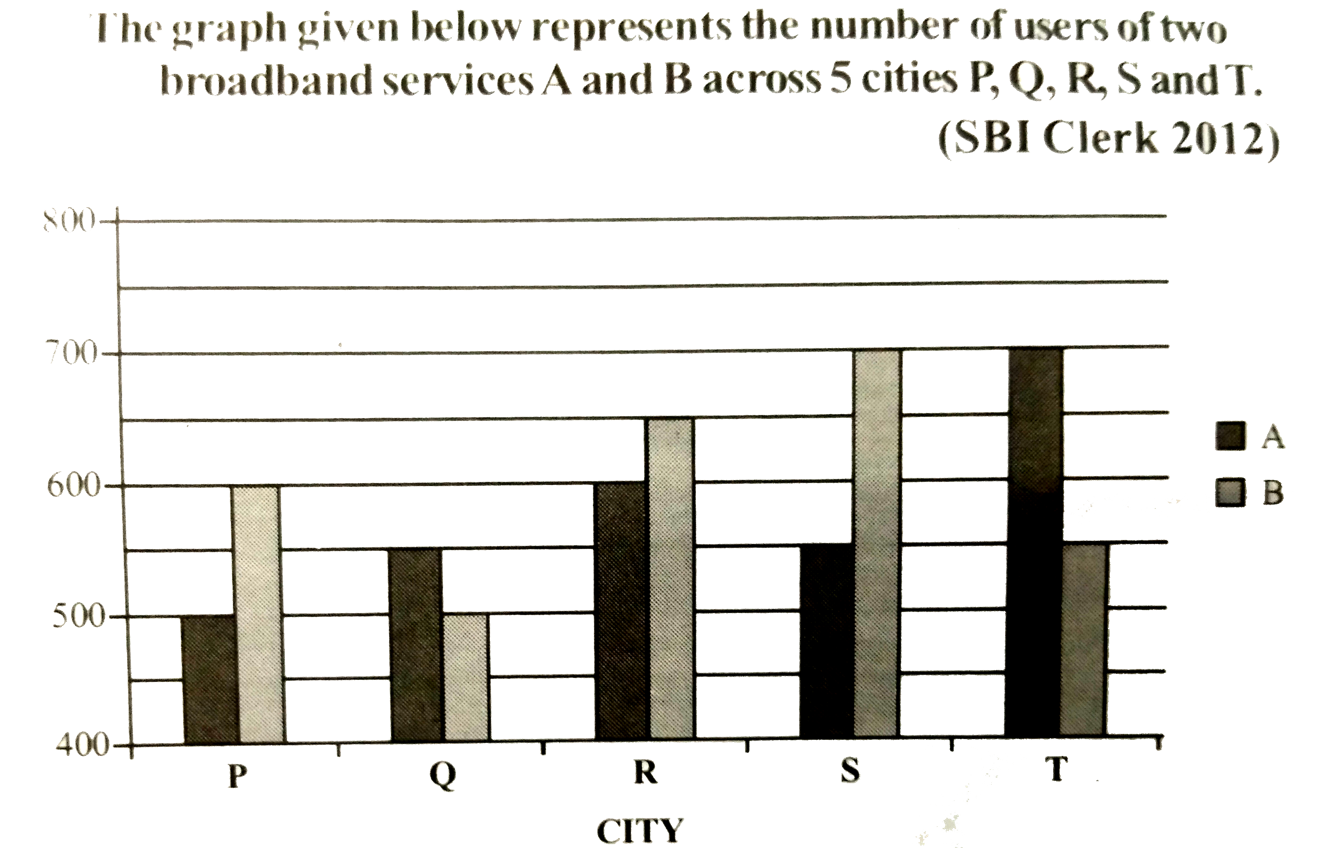
What is the difference between the total number of users of Brand A and B together in city R and the total number of users of brand A annd B together in city P ?
View SolutionDirections: There are 5 different Buildings A, B, C, D and E and the number of Total number of floors and number of vacant floors given. Read the graph carefully and answer the given questions
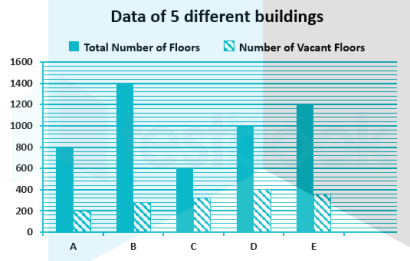
Total Number of floors = Number of Vacant Floors + Number of Occupied floors
Find the difference between the total number of occupied floors of building B and C together and that of buildings D and E together.
View Solution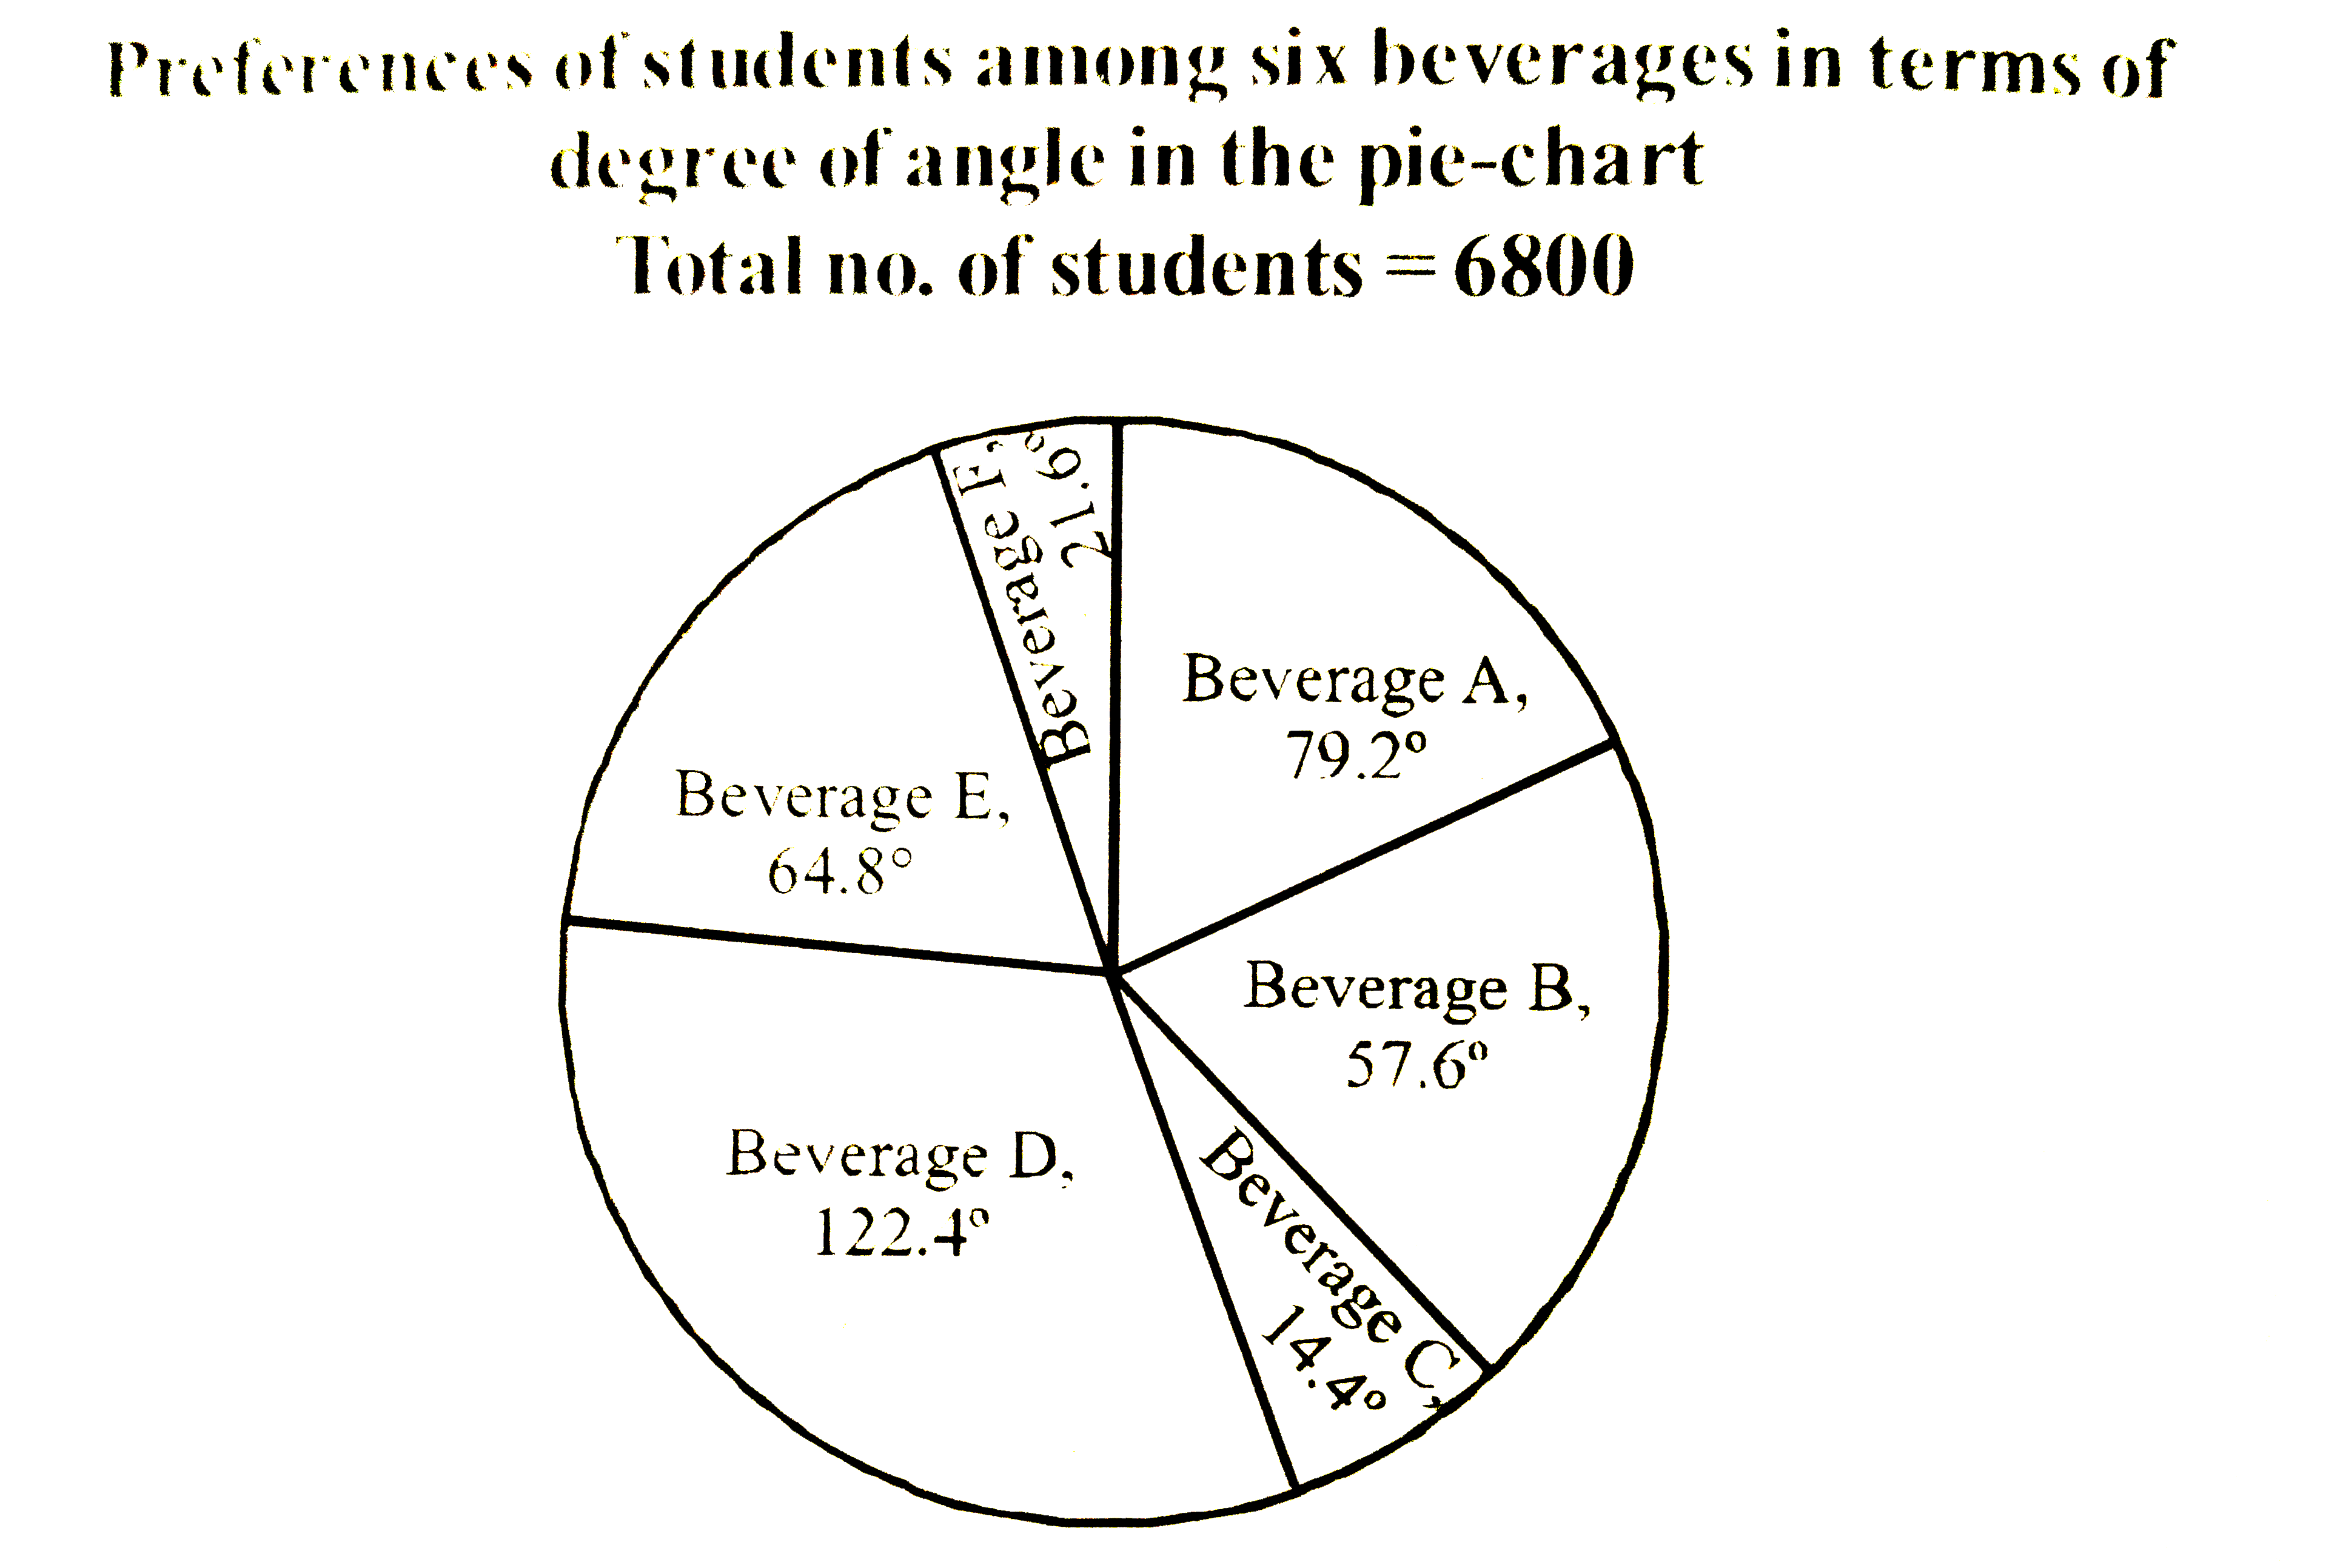
What is the differene between the total number of students who prefer Beverage A and C together and the total number of students who prefer Beverage D and F together ?
View Solution
Find the ratio between total number of workers in company P and R together to total number of officers in company P and R together ?
View SolutionDirections: Refer to the following graph and answer the given questions. Data related to the number of shoes sold by two stores (A and B )during five years:
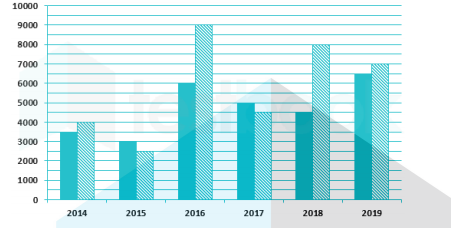
Find the ratio between the total number of shoes sold by stores A and B together in 2016 to the total number of shoes sold by stores A and B together in 2018?
View Solution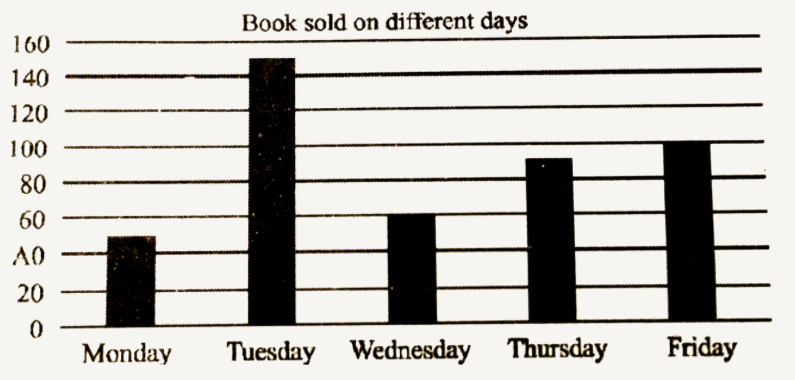
Find the difference between total number of books sold on Monday and Tuesday together to total number of books sold on Thursday and Friday together ?
View SolutionStudy the following pie chart and table to answer the question.
Total number of students admitted in a university in various fields = 5000
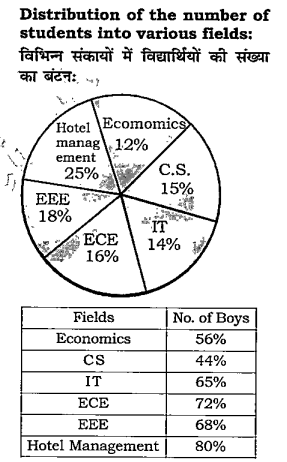 What is the difference between
the number of girls in IT and number of girls in ECE?
View Solution
