Refer to the pie chart and answer the given question.
Distribution of the total number of MRI done by five
labs in week I of April 2017
Total number=200
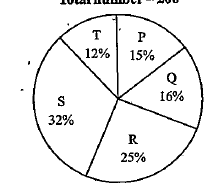
As compared to week I, in week II the number of MRIs done by Labs P and R decreased by 10% each respectively. What is the total number of MRIs done by Lab P and R together.in Week II?
76
84
80
72
The correct Answer is:D
Step by step video, text & image solution for Refer to the pie chart and answer the given question. Distribution of the total number of MRI done by five labs in week I of April 2017 Total number=200 As compared to week I, in week II the number of MRIs done by Labs P and R decreased by 10% each respectively. What is the total number of MRIs done by Lab P and R together.in Week II? by Maths experts to help you in doubts & scoring excellent marks in Class 14 exams.
Updated on:21/07/2023Similar Questions
Knowledge Check
The pie chart given below shows the number of students in 5 sections .The number of students is 7200.
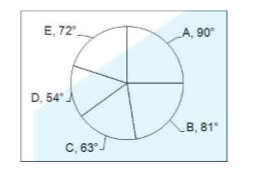
What is the total number of students in section E and section B?Aa)3060Bb)2900Cc)5300Dd)6000
Study the pie chart and answer the question

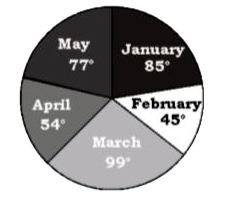
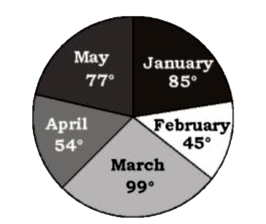
The number of months in which the number of computers sold was above 20% of the total number of computers sold in 5 months was:
View SolutionStudy the pie chart and answer the question
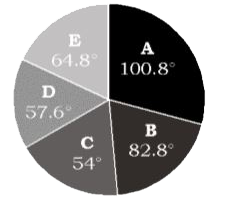
The total number of employees of the company in offices D and E in what percentage more than the number of employees in office A?
View SolutionThe bar graph shows the number of toys produced by a factory during a certain week.
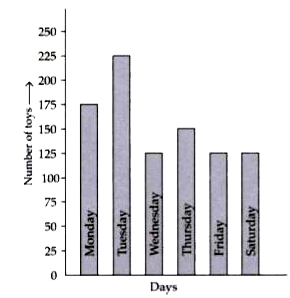
What is the total number of toys produced during the week ?
View SolutionStudy the given pie chart and answer the question that follows
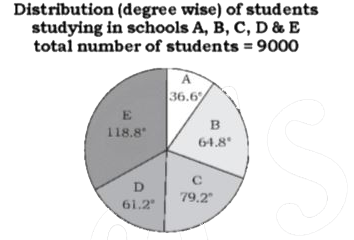
The total number of students in schools D and E is what percentage more than the number of students in schools B and C?
View SolutionStudy the pie-chart and answer the question.
Distribution (degree wise ) of the total number of employeesofa company in its five offices A,B,C,D&E.
Total Number of employees = 9200
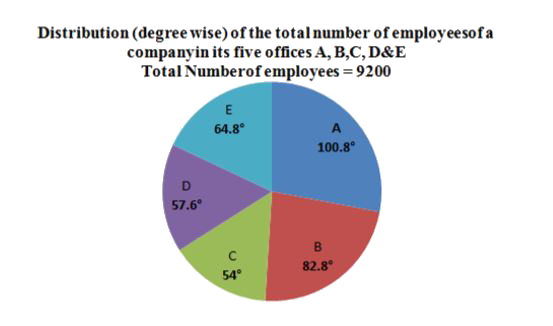
Total number of employees of the company in offices C and D exceeds the number of employees in office B by x, where X lies between:
View SolutionStudy the pie chart and answer the question. Distribution of the number of employees of a companyworking in 5 department A, B , C, D and E
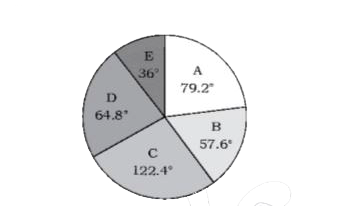
IF the total number of employees are 3200.If the total number of employees working in deparments A and B exceeds the number of employees in department C by x, then x lies between:
View SolutionStudy the pie chart and answer the question
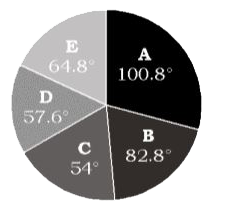
IF 50% of the employees in office E are tranferred to office D, then what percentage of the total number of employees of the company is the number of employees in office D?
View Solution
