Refer to the pie chart and answer the given question.
Distribution of the total number of MRI done by five
labs in week I of April 2017
Total number=200
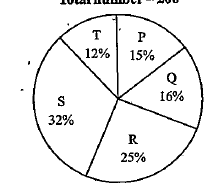
In Lab T, the ratio of the number of females who came for MRI to that of males who came for MRI was 7:5 What was the number of females who came for MRI in Lab T?
15
21
7
14
The correct Answer is:D
Step by step video, text & image solution for Refer to the pie chart and answer the given question. Distribution of the total number of MRI done by five labs in week I of April 2017 Total number=200 In Lab T, the ratio of the number of females who came for MRI to that of males who came for MRI was 7:5 What was the number of females who came for MRI in Lab T? by Maths experts to help you in doubts & scoring excellent marks in Class 14 exams.
Updated on:21/07/2023Similar Questions
Knowledge Check
Study the Pie chart carefully and answer the questions.
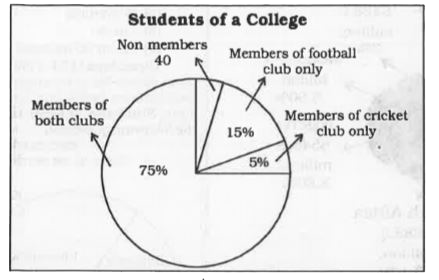
The number of students who are members of both the club is :A500B650C550D600The number of pupils of a class is 55. The ratio of the number of male pupils to the number of female pupils is 5:6. The number of female pupils is
A11B25C30D35The total number of families that came under the survery is
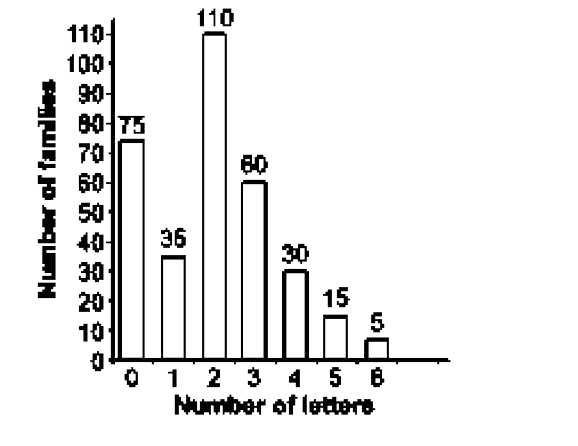 A110B250C300D330
What is the full form of MRI ?
View Solution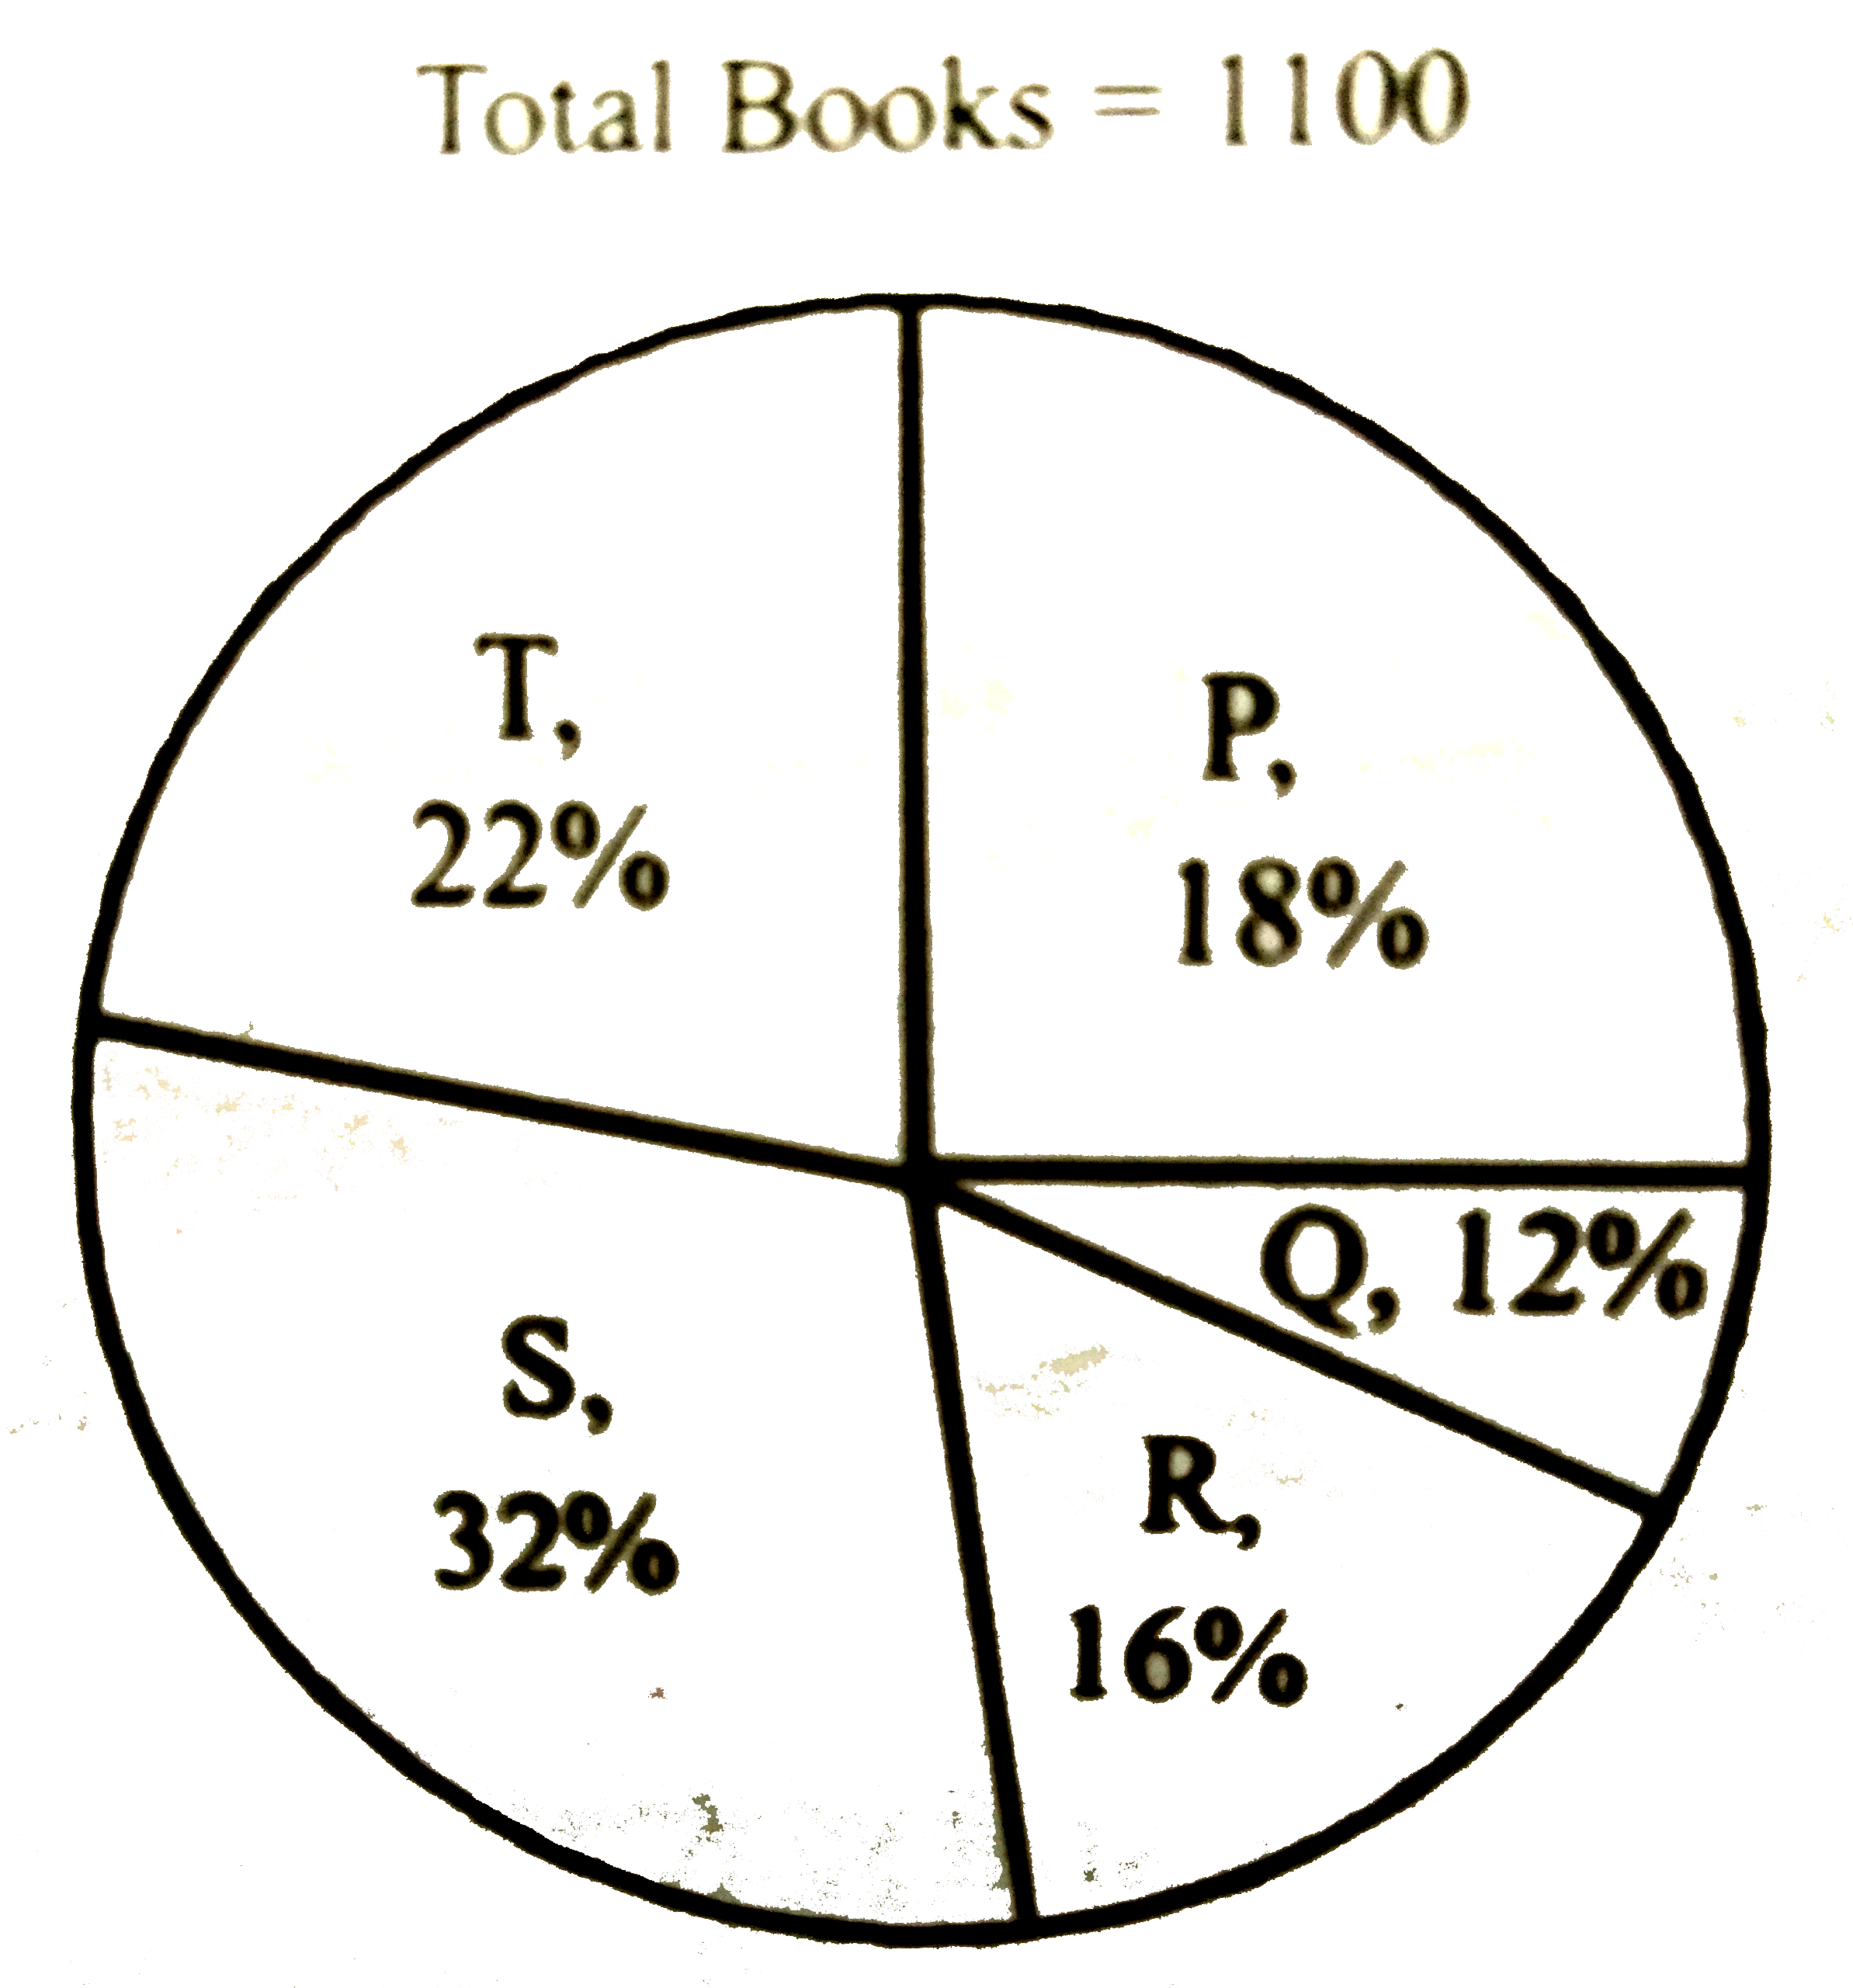
If number of female who bought the books in store T are 42 more than number of males who bought books from same store then find the number of females who bougth book in store T .
View SolutionStudy the pie chart and answer the question Distribution of the number of employees of a companyworking in 5 departments A B C D and E
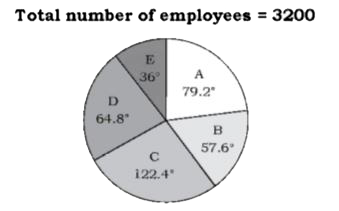
If the ratio of male employees and female employees working in department D is 4:5 and that in department E is 9:11 then what is the ratio of the total male employees in D and E to the number of employees in B.
View Solution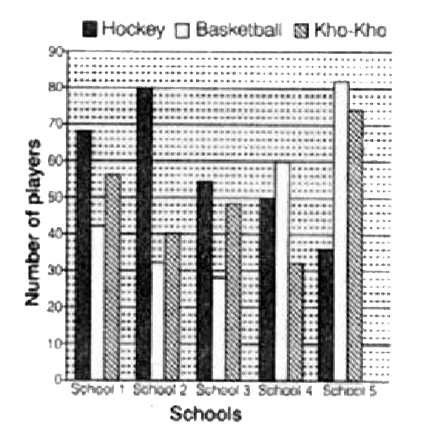
25% of the numbers of the players participating in hockey from school 5 are females. What is the number of the hockey players who are males in school 5
View SolutionDirections: The given pie-charts compares the total population and the female population of six countries, Australia, Canada, Germany, India, USA and Philippines. The first pie chart gives the percentage distribution of the total population of the six countries, while, the second pie chart gives the percentage distribution of the female population of the six countries. Study the pie-charts and answer the questions that follow.
If the total number of females in India and USA is equal to the total population of the Philippines, then what is the ratio of the number of males in Australia to the number of females in Canada?
View Solution

