Refer to the pie chart and answer the given questions.
Percentage distribution of rice to 5 retailers A, B, C, D and E from a granary (having total quantity=800 kg) in
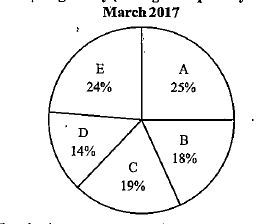
What is the average quantity of rice distributed to retailers B, C and D? (in kg)
136
142
140
146
The correct Answer is:A
Step by step video, text & image solution for Refer to the pie chart and answer the given questions. Percentage distribution of rice to 5 retailers A, B, C, D and E from a granary (having total quantity=800 kg) in What is the average quantity of rice distributed to retailers B, C and D? (in kg) by Maths experts to help you in doubts & scoring excellent marks in Class 14 exams.
Updated on:21/07/2023Similar Questions
Study the graph and answer the question
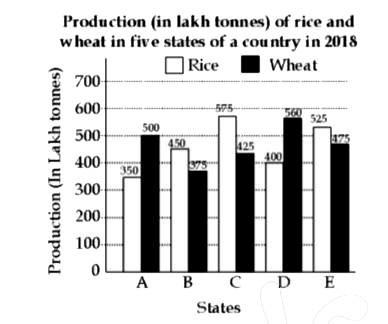
Total production of wheat in states A , B and E is what percentage less than the total production of rice in states C, D and E?
View SolutionStudy the graph and answer the question
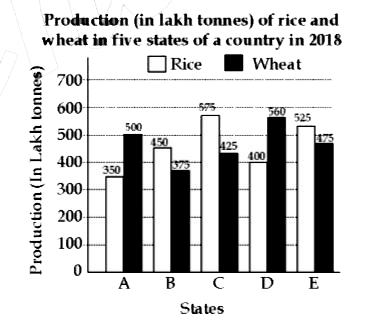
the ratio of the total production of rice in states C and E to the total production of wheat in states B and D is……..
View Solution
Knowledge Check
Study the graph and answer the question.
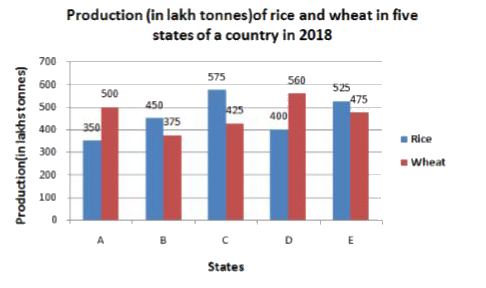
Total production of wheat in states A, B and E is what percentage less than the total production of rice in states C, D and E?A10B12C12.2D11.1Study the pie-chart and answer the question. Distribution (degree-wise) of the number of employees of a company working in 5 departments A, B, C, D and E.
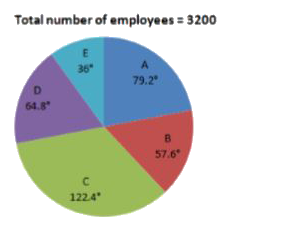
The number of employees working in department C is what percentage more than the total number of employees working in D and E? (Your answer should be correct to one decimal place.)A23.2B20.6C22.8D21.4
The given pie chart shows the quantity wise sales distribution of five products (A, B, C, D and E) of a company in 2016.
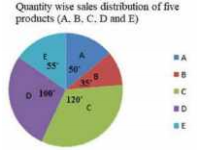 In 2016, if a total of 14616 units were sold, then the number of units of products D sold was:
View SolutionThe given pie chart shows the quantity wise sales distribution of five products (A, B, C, D and E) of a company in 2016.
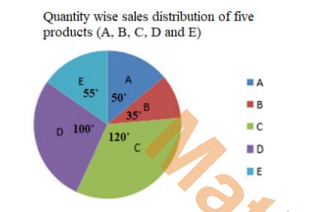 In 2016, if a total of 14616 units were sold, then the number of units of products D sold was:
View SolutionStudy the pie chart and answer the question. Distribution of the number of employees of a companyworking in 5 department A, B , C, D and E
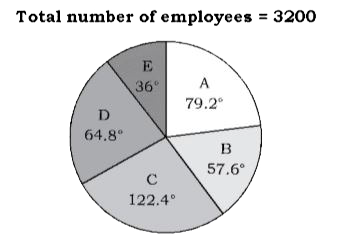
the number of employees working in department C is what percentage more than the total number of employees working in D and E?
View SolutionStudy the given pie chart and answer the question that follows
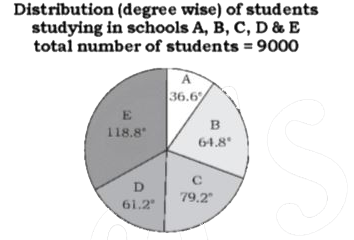
The total number of students in schools D and E is what percentage more than the number of students in schools B and C?
View SolutionDirections: The given pie-charts compares the total population and the female population of six countries, Australia, Canada, Germany, India, USA and Philippines. The first pie chart gives the percentage distribution of the total population of the six countries, while, the second pie chart gives the percentage distribution of the female population of the six countries. Study the pie-charts and answer the questions that follow.
If the total number of females in India and USA is equal to the total population of the Philippines, then what is the ratio of the number of males in Australia to the number of females in Canada?
View SolutionStudy the following pie-charts carefully and answer the questions.
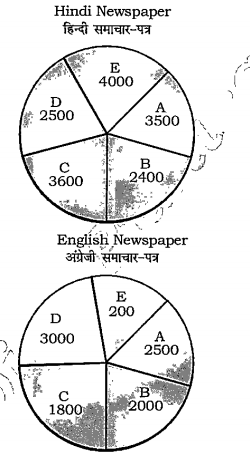 In five localities A, B, C, D and E selling detail of Hindi and English newspaper
What is the average of difference of sales of Hindi and English newspapers in all localities ?
View Solution