Refer to the pie chart and answer the given questions.
Distribution of total number of brownies
sold by five different bakeries
Total number=320

The ratio of the number of chocolate brownies to that of vanilla brownies sold by Bakery B is 5:3 and the ratio of the number of chocolate brownies to that of vanilla brownies sold by Bakery C is 3 :1. What is the total number of chocolate brownies sold, by bakeries-C and B together? (Bakeries B and C sell only chocolate and vanilla brownies.)
130
120
100
150
The correct Answer is:C
Step by step video, text & image solution for Refer to the pie chart and answer the given questions. Distribution of total number of brownies sold by five different bakeries Total number=320 The ratio of the number of chocolate brownies to that of vanilla brownies sold by Bakery B is 5:3 and the ratio of the number of chocolate brownies to that of vanilla brownies sold by Bakery C is 3 :1. What is the total number of chocolate brownies sold, by bakeries-C and B together? (Bakeries B and C sell only chocolate and vanilla brownies.) by Maths experts to help you in doubts & scoring excellent marks in Class 14 exams.
Updated on:21/07/2023Similar Questions
Study the pie chart and answer the question
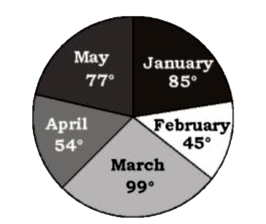
The total number of computers sold in February and April is what percentage more than the number of computers sold in May
View SolutionStudy the pie chart and answer the question

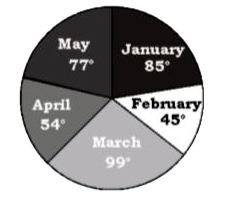
The number of months in which the number of computers sold was above 20% of the total number of computers sold in 5 months was:
View Solution
Knowledge Check
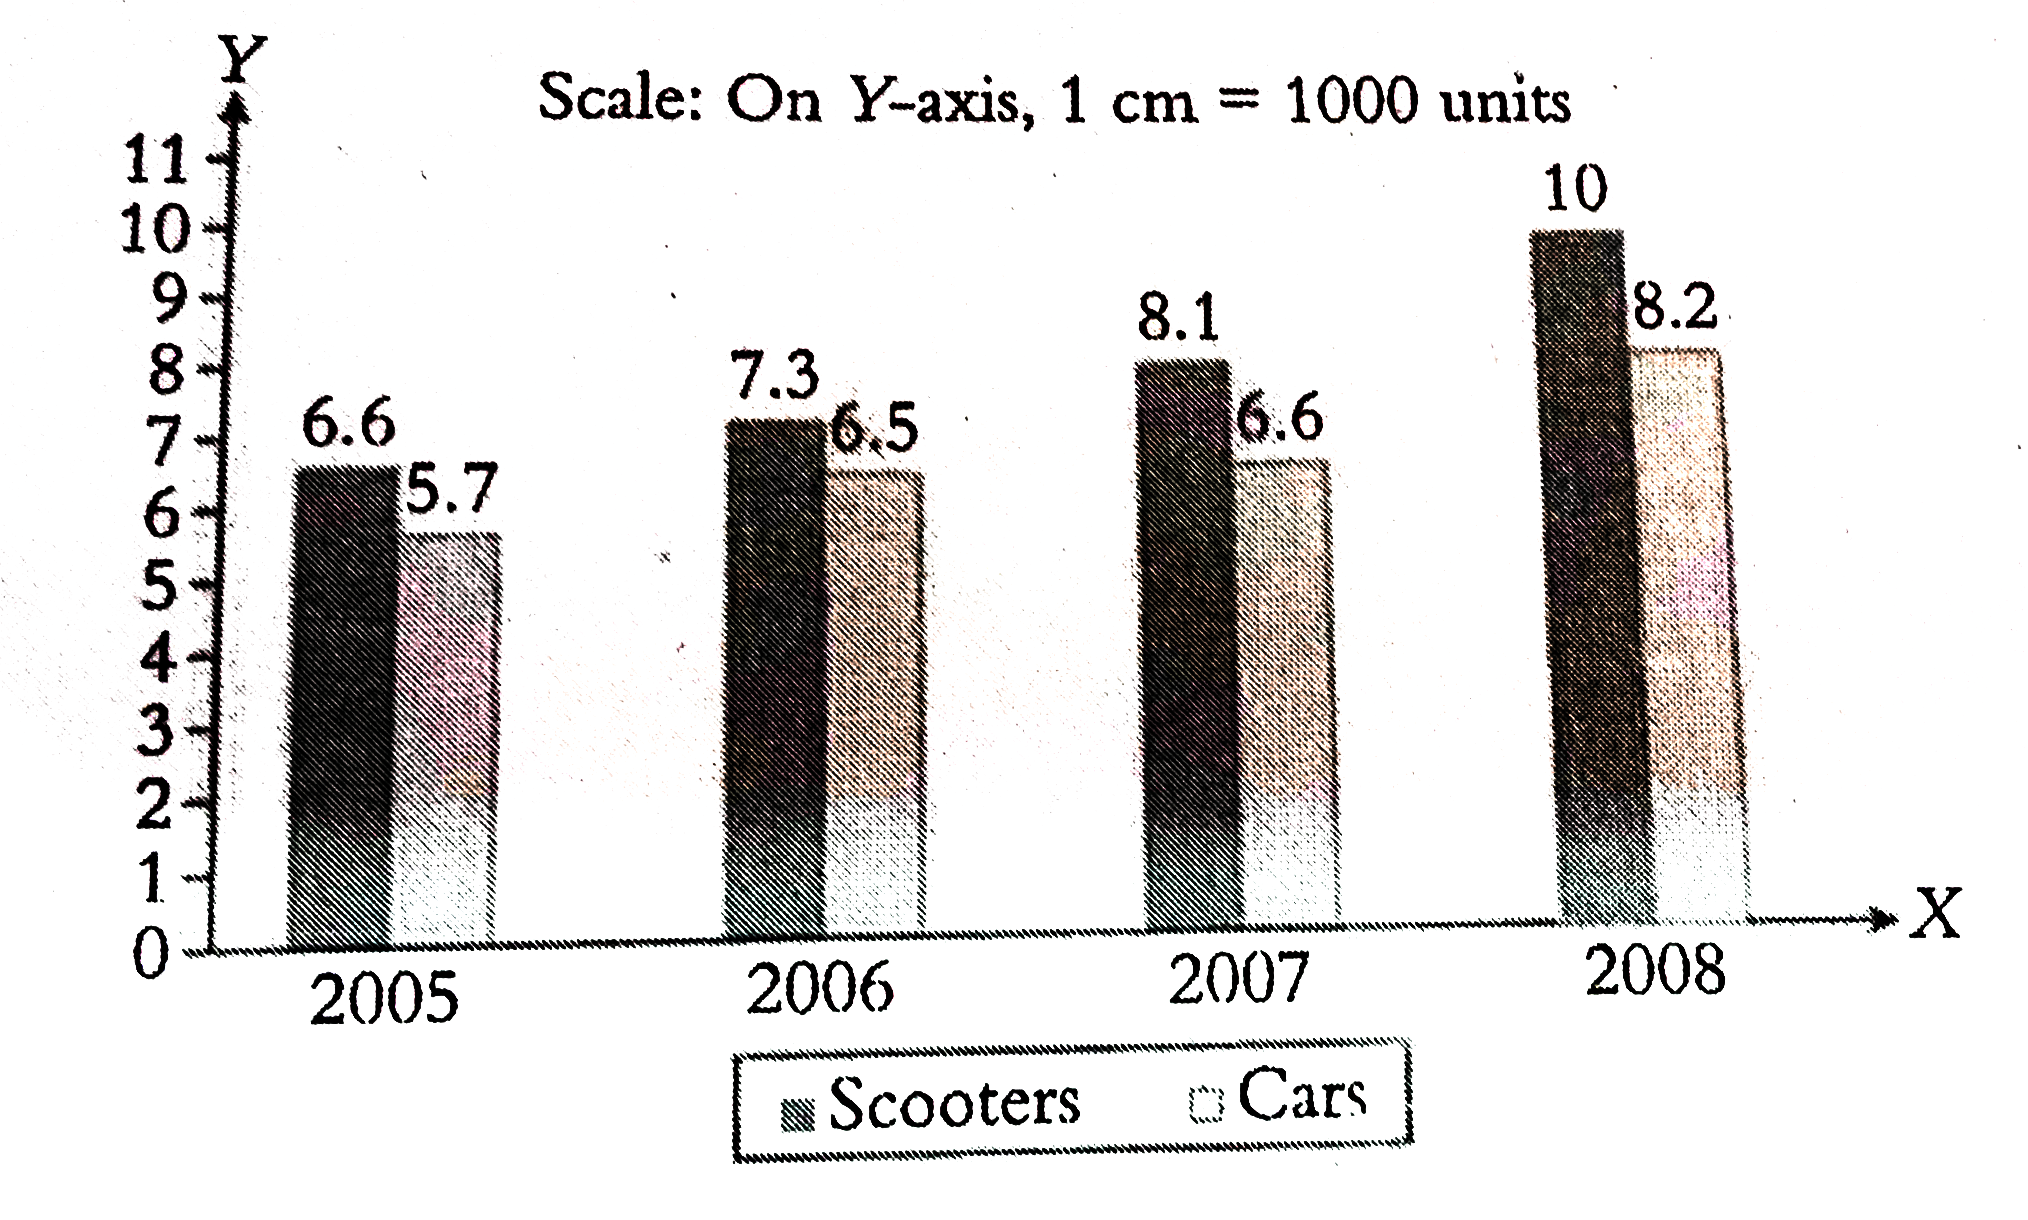
Find the total number of scooters sold in the four years.A26000B27000C31000D32000The given bar graph presents the sale of a particular brand of car by three showrooms, A, B and C( in multiples of 100) during the months of Jan, Feb, Mar and Apr, 2016
दिया गया दंड आरेख (बार ग्राफ) तीन शो-रूम- A, B और C के द्वारा जनवरी, फरवरी, मार्च और अप्रैल, 2016 के दौरान कार के एक खास ब्रांड की (100 के गुणक में) बिक्री को दर्शाता है|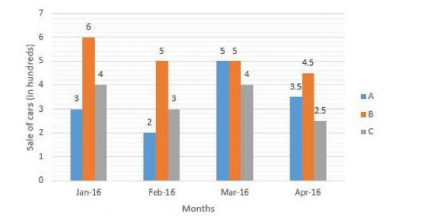 What is the ratio of the number of cars sold by A in Jan-Feb, 2016 to that of cars sold by B during Mar-Apr, 2016?
जनवरी-फरवरी, 2016 में A के द्वारा और मार्च-अप्रैल, 2016 के दौरान B के द्वारा बेची गई कारों की संख्या का अनुपात क्या है?A5:18B8:17C12:19D10:19The given table represents the number of computers sold by four dealers A,B, C and D during the first six months of 2016. Study the table carefully and answer the questions that follows:
दी गयी तालिका चार विक्रेताओं A, B, C और D के द्वारा 2016 के पहले छः महीनों में बेचे गए कंप्यूटरों की संख्या दर्शाती है | इस तालिका का ध्यानपूर्वक अध्ययन करें तथा पूछे गए प्रश्नों का उत्तर दें |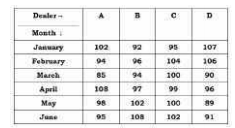 What is the ratio of the total number of computers sold by dealer A in February, April and May to the total number of computers sold by dealer D in March, May and June? /
विक्रेता A के द्वारा फरवरी, अप्रैल और मई में बेचे गए कंप्यूटरों की कुल संख्या तथा विक्रेता D के द्वारा मार्च, मई और जून में बेचे गए कंप्यूटरों की कुल संख्या के बीच क्या अनुपात है ?A15:13B10:9C6:5D20:27
Directions: Refer to the following graph and answer the given questions. Data related to the number of shoes sold by two stores (A and B )during five years:
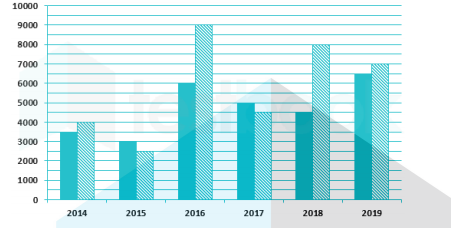
Find the ratio between the total number of shoes sold by stores A and B together in 2016 to the total number of shoes sold by stores A and B together in 2018?
View Solution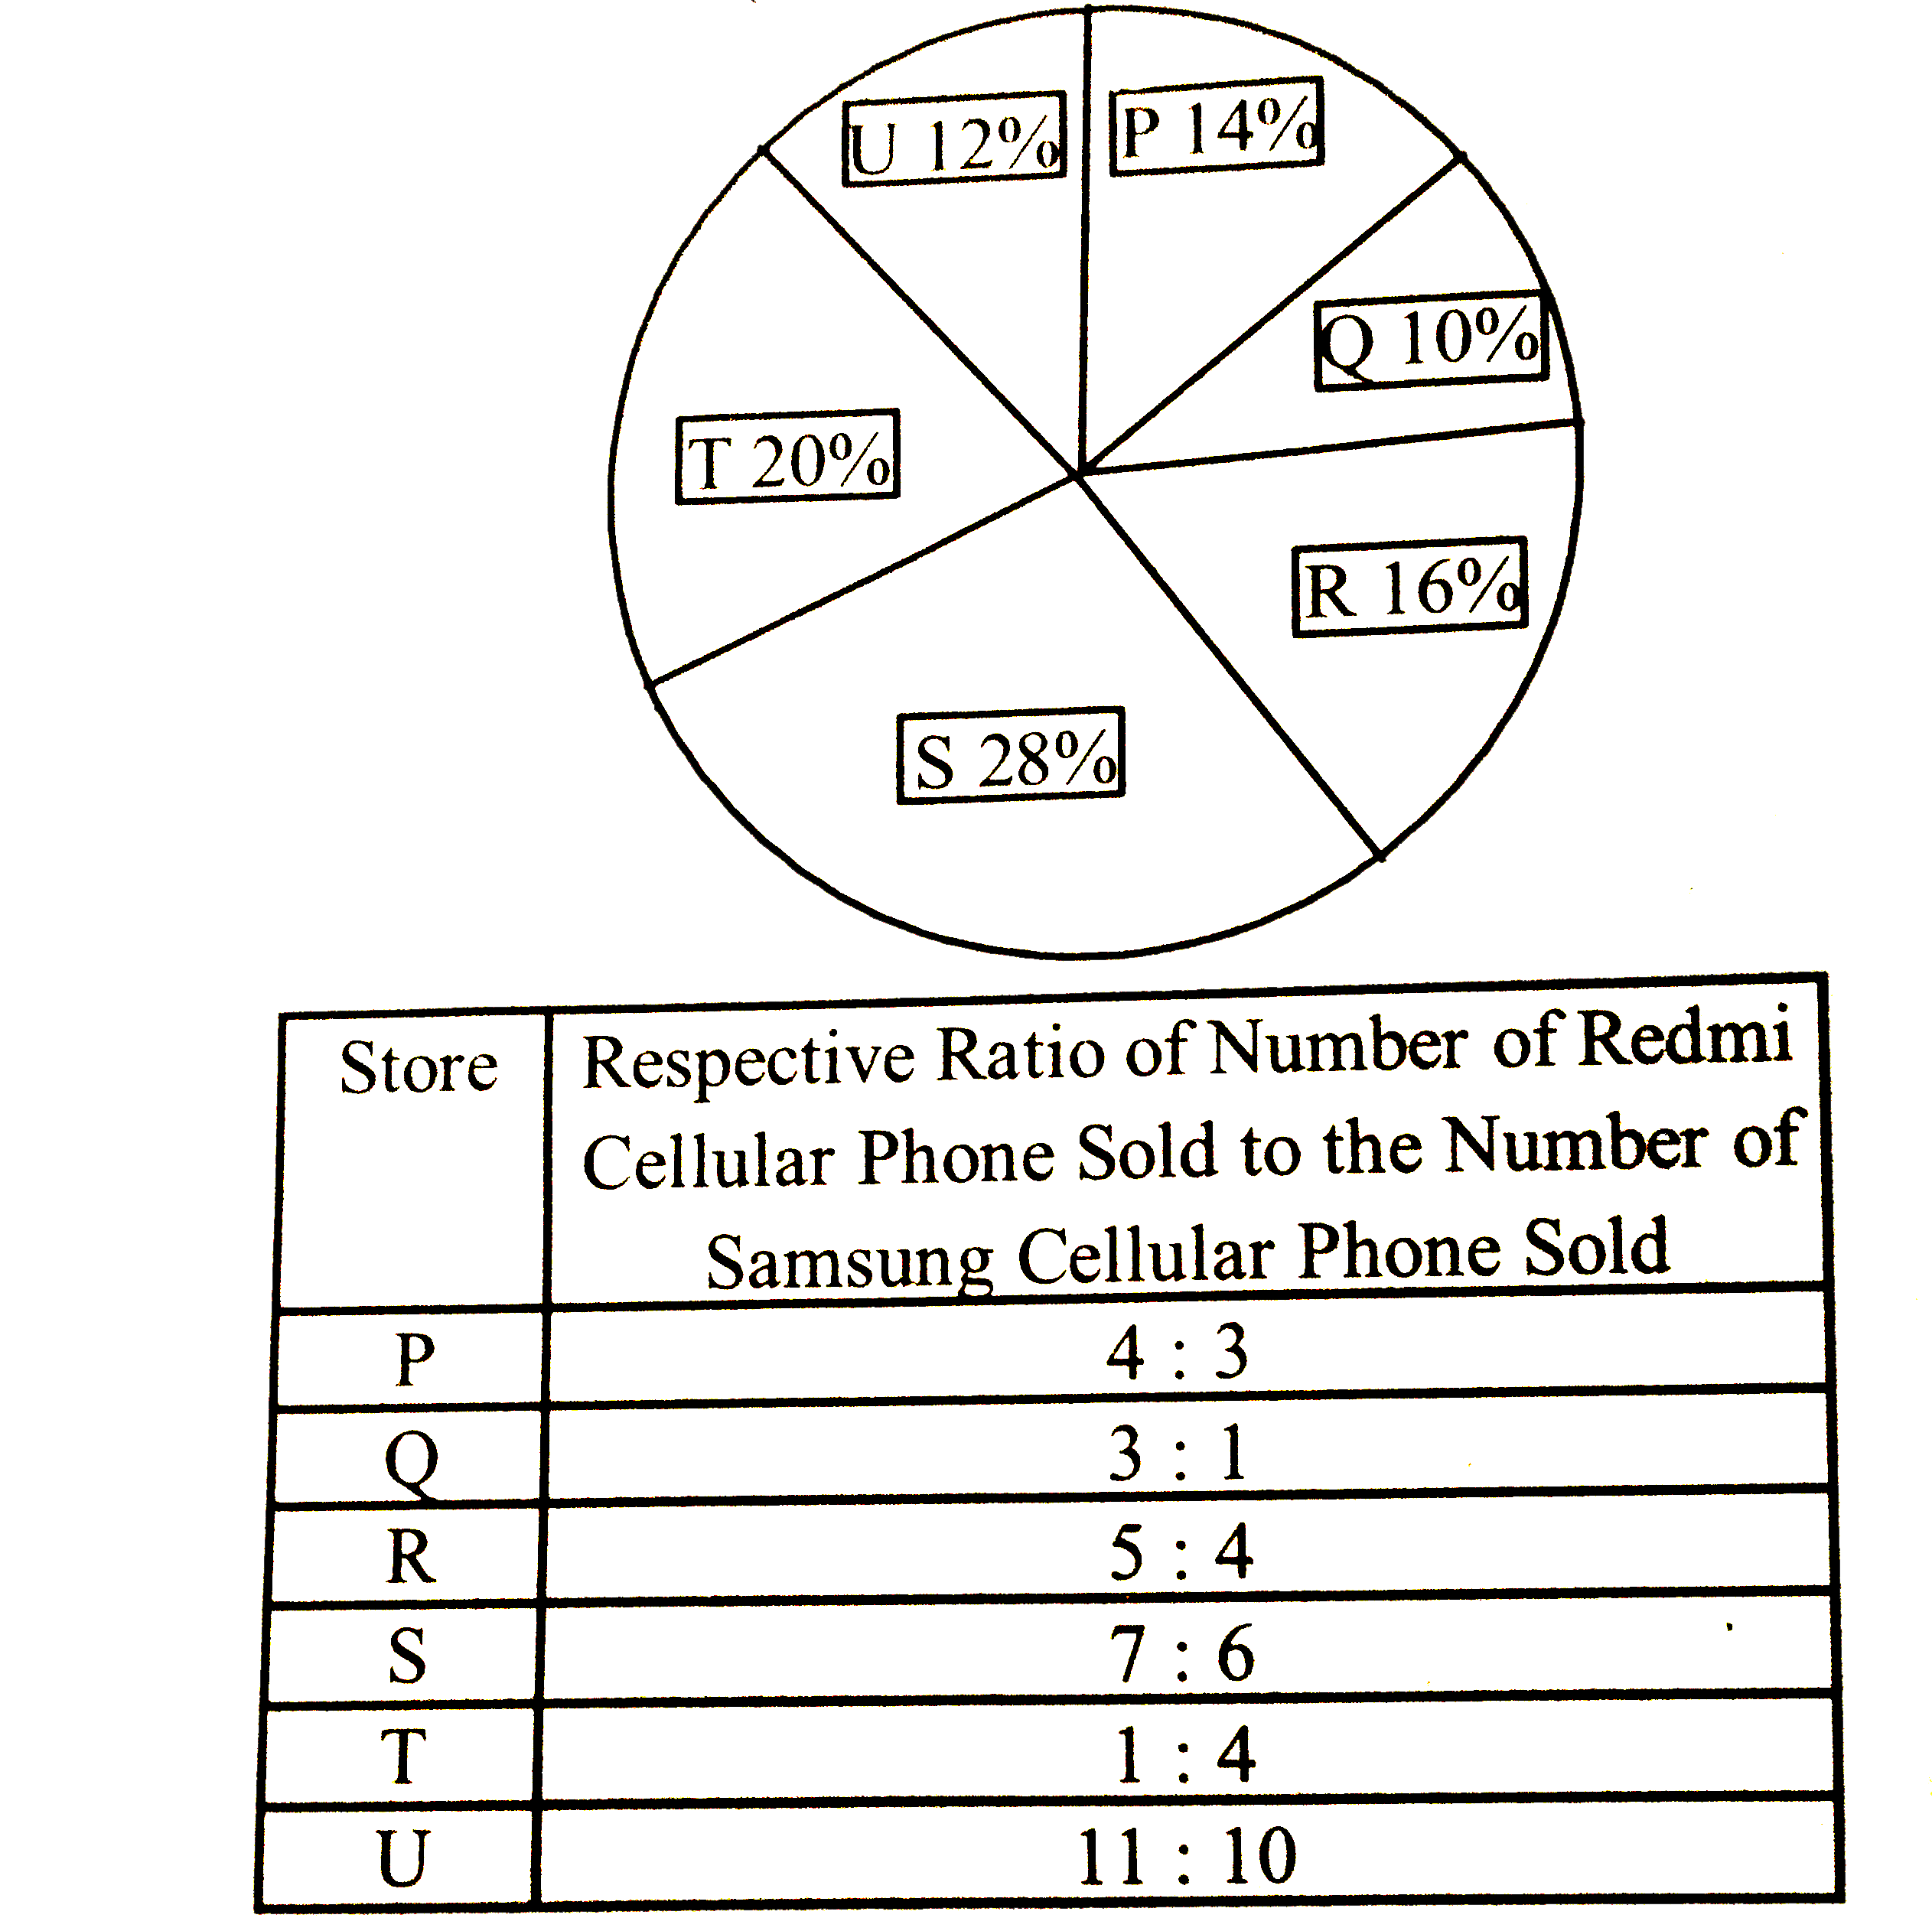
What is the respective ratio between number of Redmi cellular phones sold by stor S and total number of Samsung cellular phones sold by stores T and U together ?
View SolutionStudy the following pie-charts carefully to answer the questions.
Percentage break-up of number of children in five different villages
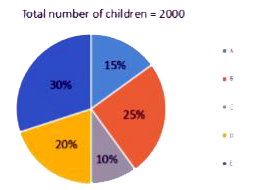
What is the respective ratio of total number of children from village A to village C ?
View SolutionIf the number of cars sold of model D is 72900, then what is the total number of cars sold of all the models together by the company?
View SolutionThe given table represents the sale (in thousands) of cars by four companies A,B,C and D in six years. Study the table and answer the questions that follow:
दी गयी तालिका चार कंपनियों - A, B, C और D के द्वारा छः वर्षों में की गयी कारों की बिक्री ( हज़ार में ) दर्शाती है | इस तालिका का अध्ययन करें तथा फिर पूछे गए प्रश्नों के उत्तर दें |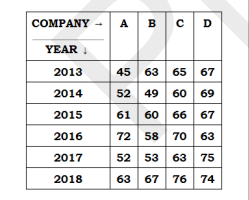 What is the ratio of total number of cars sold by companies A,B and D in 2017 to the total number
of cars sold by all companies in 2018?
कंपनी A, B और D के द्वारा 2017 में बेची गयी कारों की कुल संख्या तथा 2018 में सभी कंपनियों के द्वारा बेची गयी कारों की कुल संख्या के बीच क्या अनुपात है ?
View Solution
