Refer to the pie-chart and answer the given questions.
Distribution of the total number of boots sold of 5 different brands:
Total Number of boots sold=800
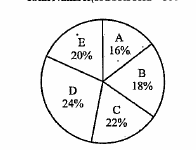
The number of boots sold of brand F was 15% less than that of brand E. If man’s boots sold of brand F was 36 less than women’s boots sold of the same brand, what was the number of women’s boots sold of brand F?
84
74
62
86
The correct Answer is:D
Step by step video, text & image solution for Refer to the pie-chart and answer the given questions. Distribution of the total number of boots sold of 5 different brands: Total Number of boots sold=800 The number of boots sold of brand F was 15% less than that of brand E. If man’s boots sold of brand F was 36 less than women’s boots sold of the same brand, what was the number of women’s boots sold of brand F? by Maths experts to help you in doubts & scoring excellent marks in Class 14 exams.
Updated on:21/07/2023Similar Questions
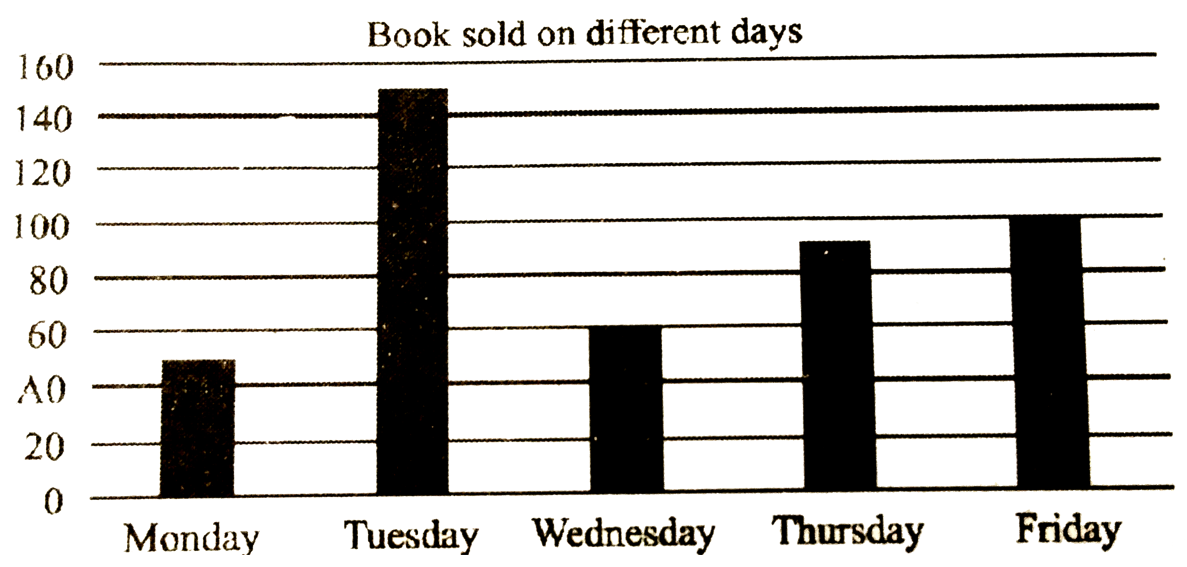
Total number of books sold on Tuesday are 25% more than total number of books sold on Sunday. Find total number of books sold on Sunday ?
View SolutionStudy the pie chart and answer the question
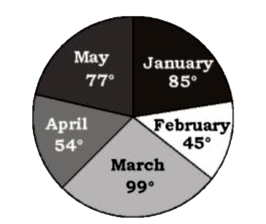
The total number of computers sold in February and April is what percentage more than the number of computers sold in May
View Solution
Knowledge Check
Hang up your boots
ATo dry your shoesBTo be rejectedCTo hang upside downDTo take retirementIf 5% of the total number of cars sold of model E is 750, then what is the average number of cars sold of all the models?
A15000B14400C16800D14000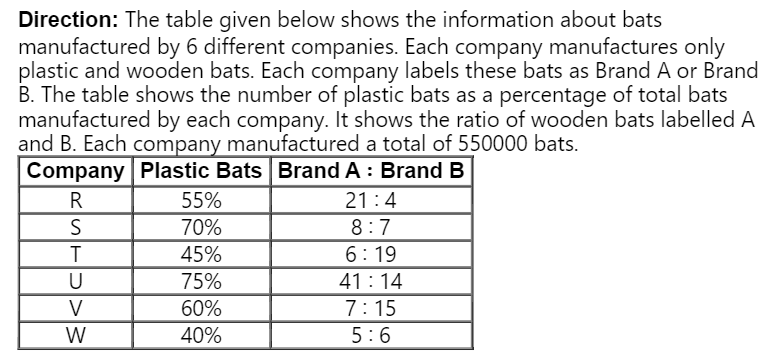
What is the total number of wooden bats of brand A manufactured by company T?A23420B22990C68920D72600
Study the pie chart and answer the question

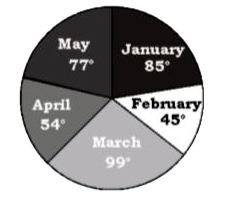
The number of months in which the number of computers sold was above 20% of the total number of computers sold in 5 months was:
View Solution
Total number of books sold on Saturday is 40% more than total number of books sold on Wednesday. Find total number of books sold on Friday and Saturday together ?
View Solution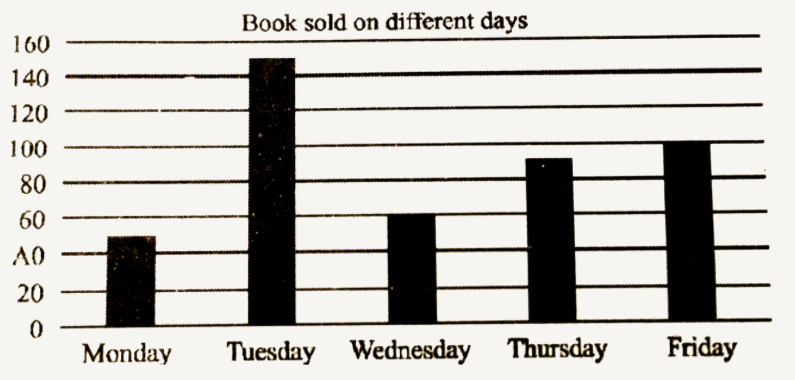
Find the difference between total number of books sold on Monday and Tuesday together to total number of books sold on Thursday and Friday together ?
View SolutionThe bar graph shows the number of cars of different brands sold by a dealer in a month. Study the diagram and answer the following questions.
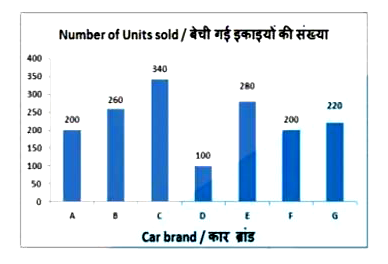
Units sold of brand D was lesser than that of brand F by _______.
View SolutionThe bar graph shows the number of motorcycles of different brands sold by dealer in a month . Study the diagram and answer the following questions.
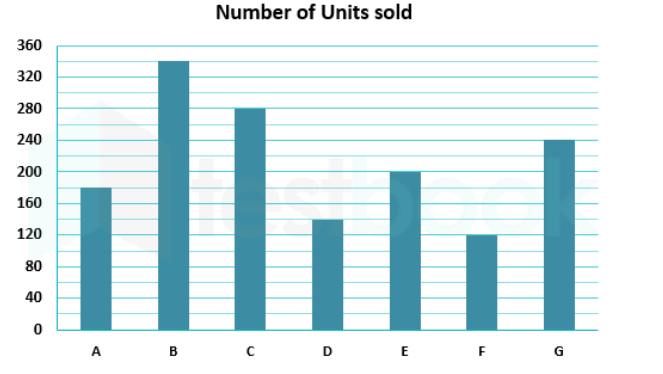
Units sold of brand D was lesser than that of brand E by _______.
View Solution
