Refer to the pie-chart and answer the given questions.
Distribution of the total number of boots sold of 5 different brands:
Total Number of boots sold=800
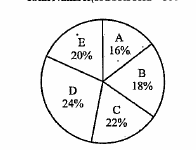
What is the central angle corresponding to the number of boots sold of brand C ?
79.2∘
73.4∘
77.6∘
71.5∘
The correct Answer is:A
Step by step video, text & image solution for Refer to the pie-chart and answer the given questions. Distribution of the total number of boots sold of 5 different brands: Total Number of boots sold=800 What is the central angle corresponding to the number of boots sold of brand C ? by Maths experts to help you in doubts & scoring excellent marks in Class 14 exams.
Updated on:21/07/2023Similar Questions
Study the pie chart and answer the question
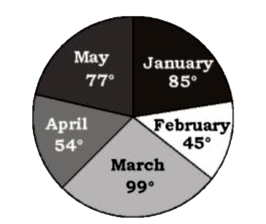
The total number of computers sold in February and April is what percentage more than the number of computers sold in May
View Solution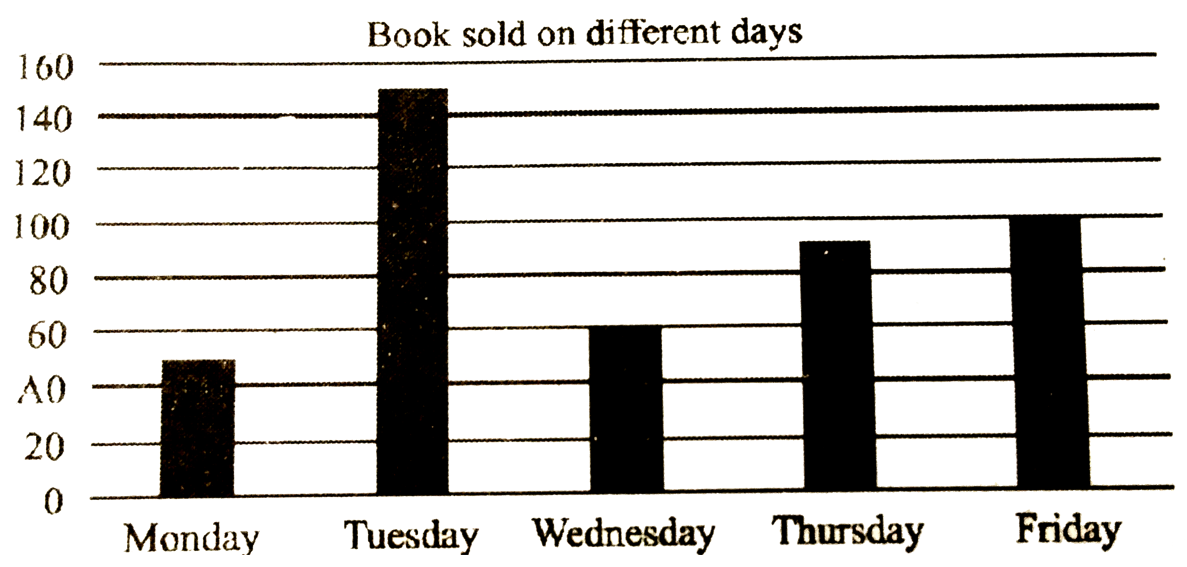
Total number of books sold on Saturday is 40% more than total number of books sold on Wednesday. Find total number of books sold on Friday and Saturday together ?
View Solution
Knowledge Check
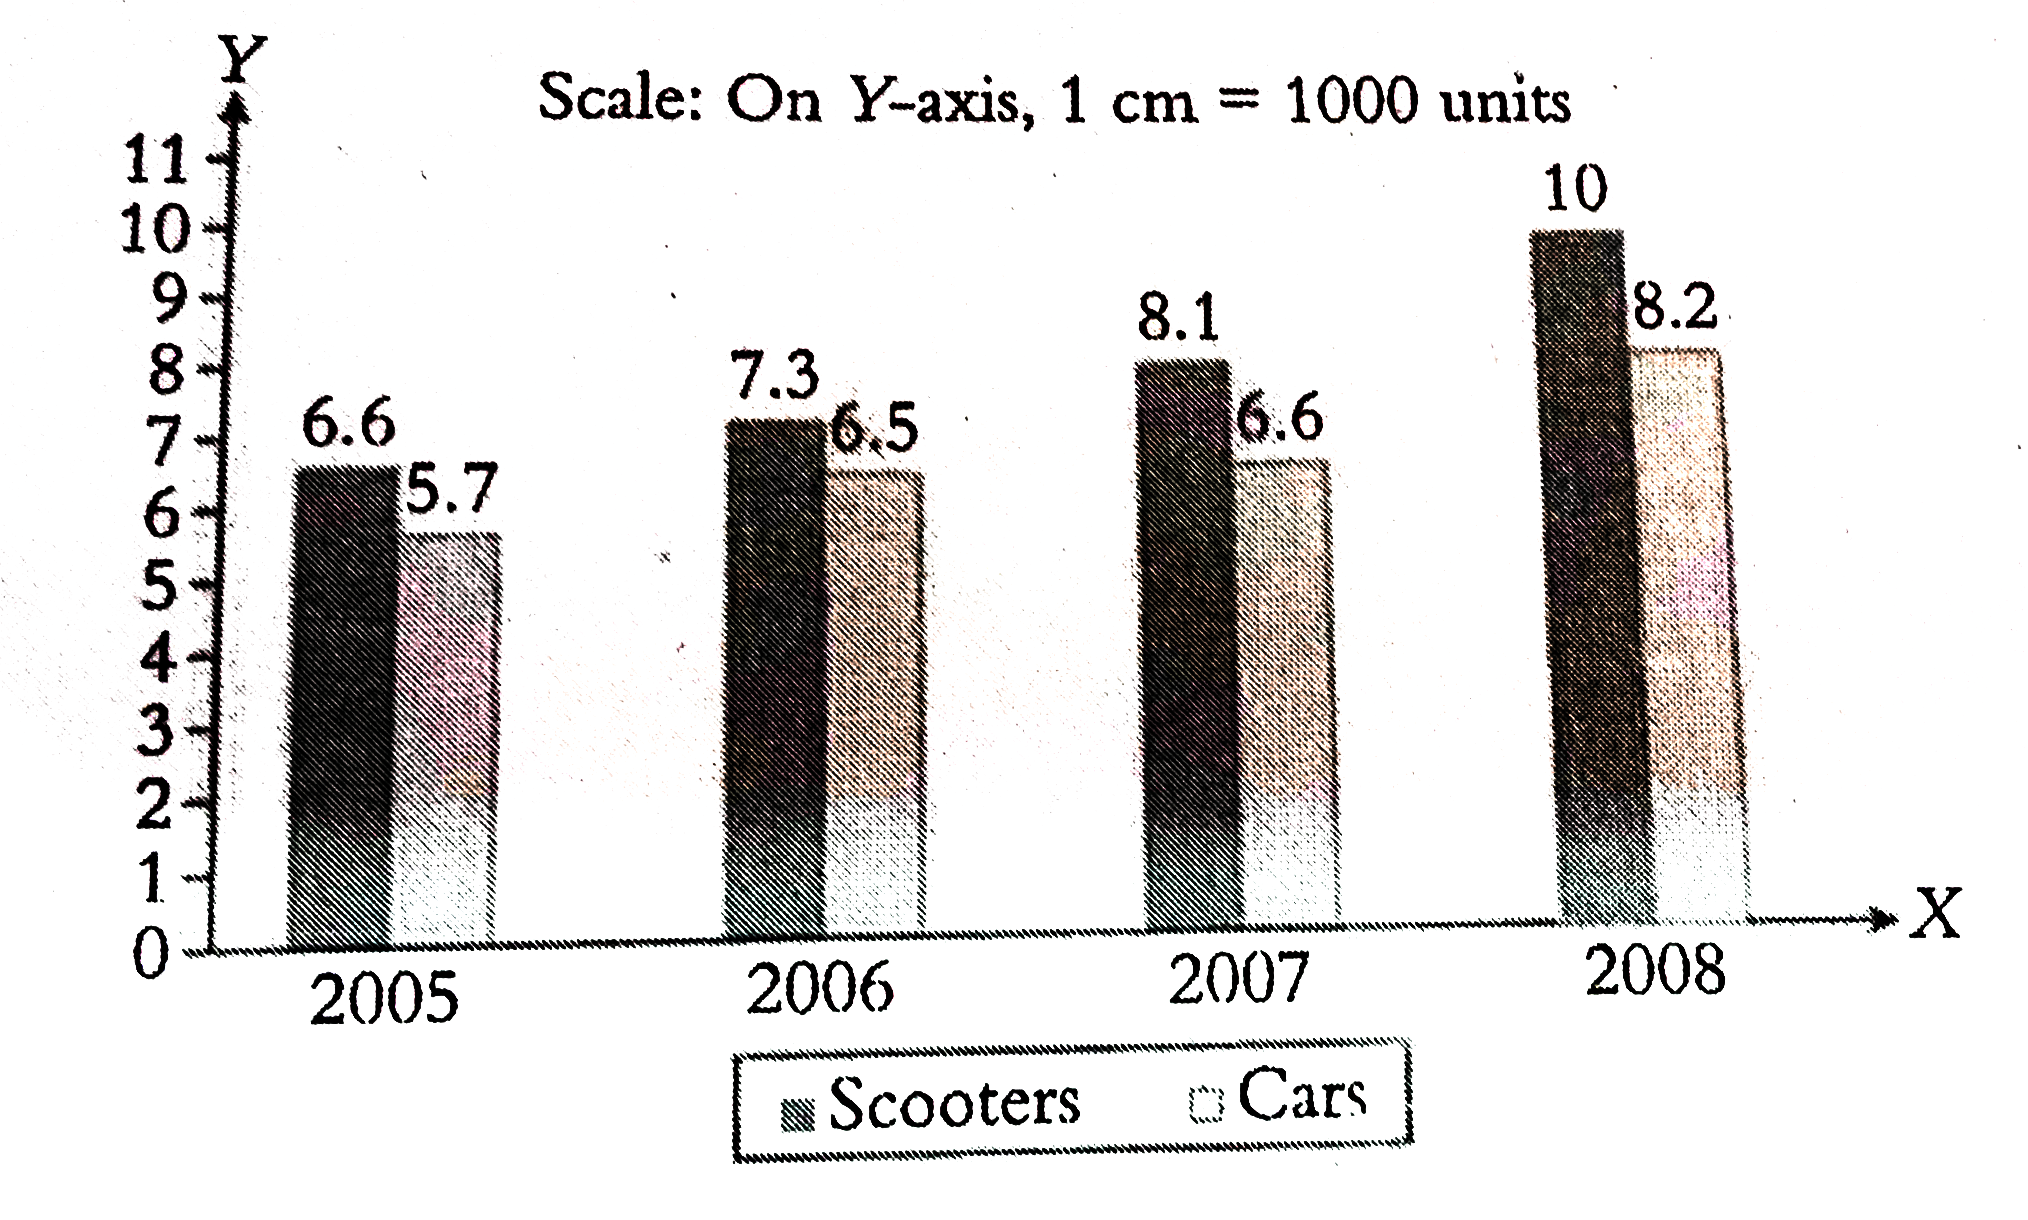
Find the total number of scooters sold in the four years.A26000B27000C31000D32000Study the graph carefully and answer the following questions.
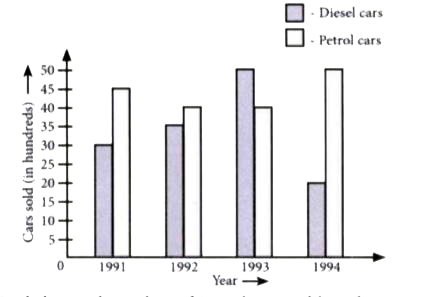
Find the total number of Diesel cars sold in the year 1992 and 1994 together.A2500B5500C1500D4500The given pie chart shows the percentage distribution of 450 employees in an organisation. Read the pie chart and answer the question that follows.
Percentage of Employees in different Departments (Total 450 Employees )
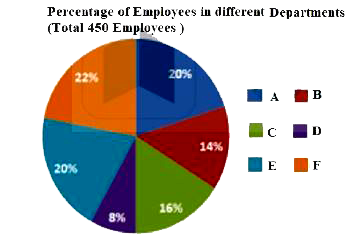
What is the central angle of the sector representing the number of employees in department E?A36∘B108∘C90∘D72∘
Study the pie chart and answer the question

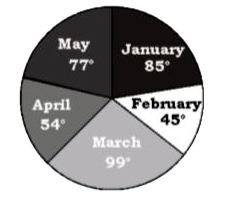
The number of months in which the number of computers sold was above 20% of the total number of computers sold in 5 months was:
View Solution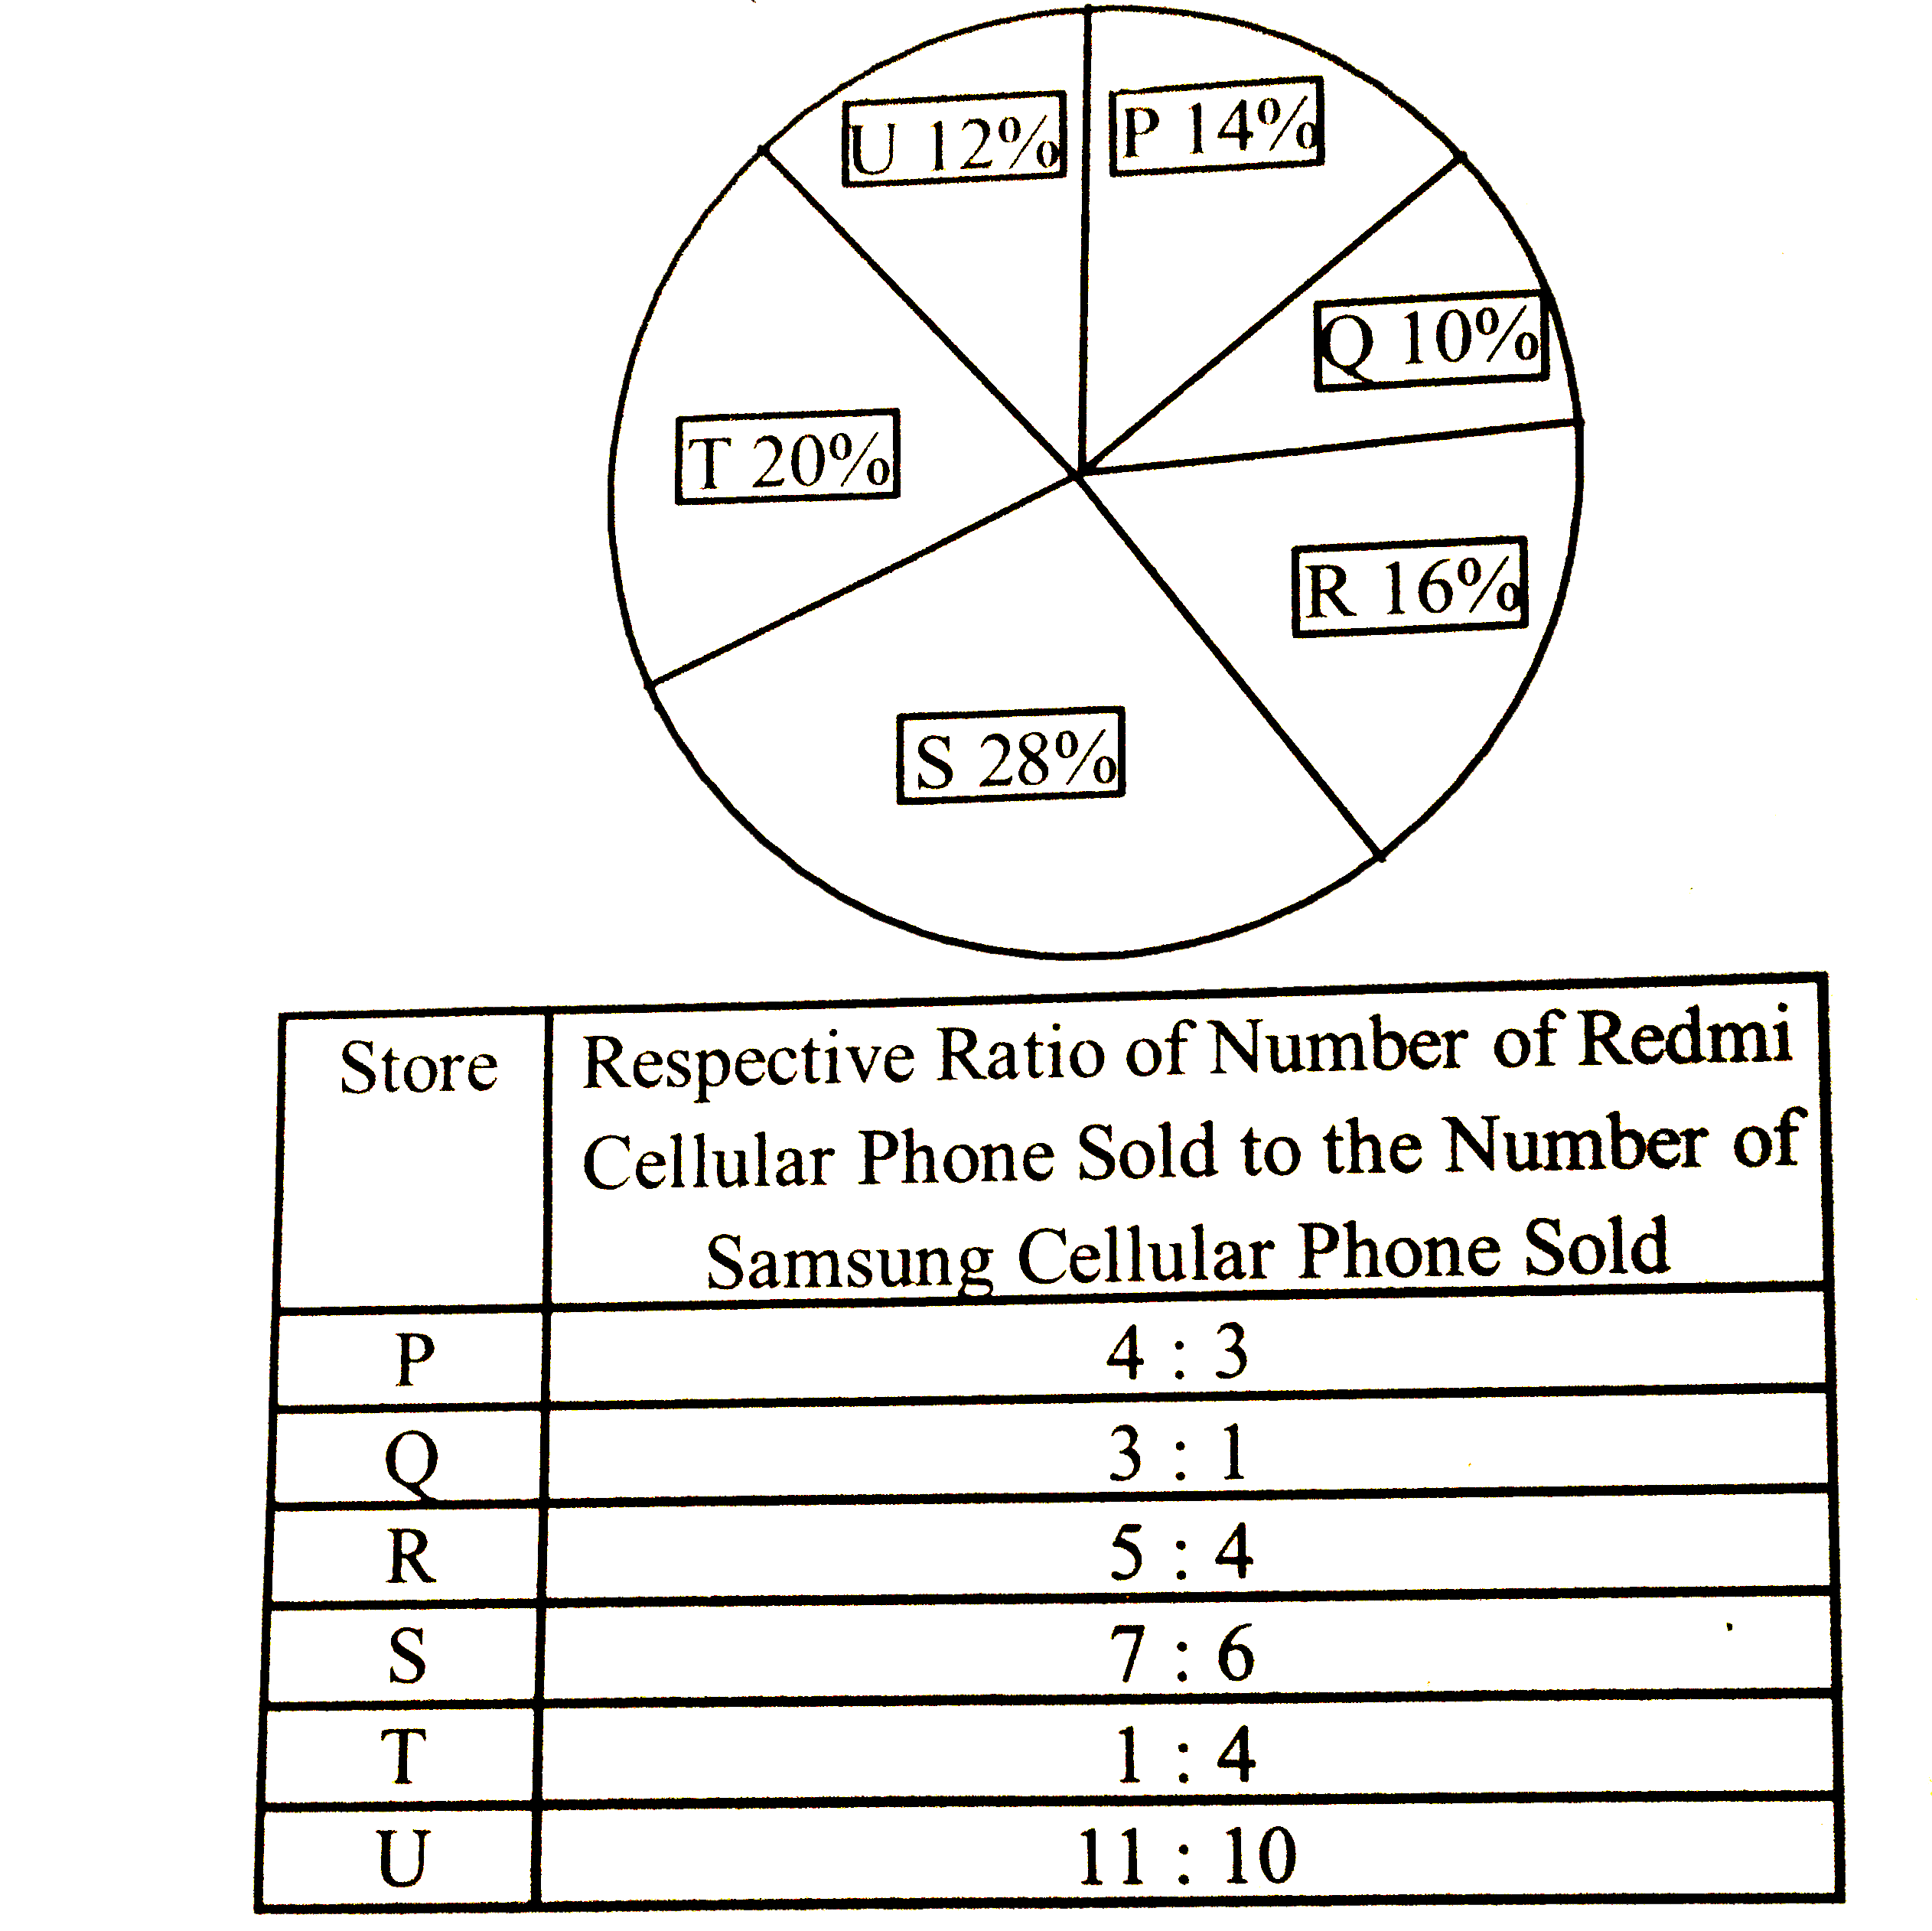
What is the central angle corresponding to total number of cellular phones (both Redmi and Samsung) sold by Store S ?
View SolutionDirections: Refer to the following graph and answer the given questions. Data related to the number of shoes sold by two stores (A and B )during five years:
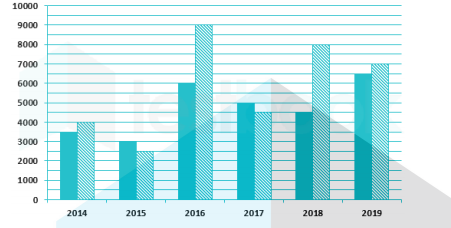
What is the difference between the total number of shoes sold by store A in 2018 and 2019 together and the total number of shoes sold by store B in 2014 and 2015 together?
View SolutionBar graph given below shows pens sold by a retailor on five different days. Study the data carefully and answer the following questions.
Pen sold on different days
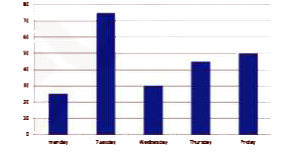
Total number of pens sold on Saturday is 40% more than total number of pens sold on Wednesday. Find total number of pens sold on Friday and Saturday together?
View Solution
Total number of books sold on Tuesday are 25% more than total number of books sold on Sunday. Find total number of books sold on Sunday ?
View Solution
