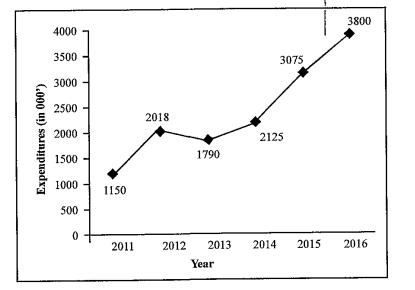
What is the average expenditure (in 000')per year from the year 2014 to 2016 ?
3120
3080
3000
3430
The correct Answer is:C
Step by step video, text & image solution for What is the average expenditure (in 000')per year from the year 2014 to 2016 ? by Maths experts to help you in doubts & scoring excellent marks in Class 14 exams.
Updated on:21/07/2023Similar Questions
The Table presents the annual expenses on various heads made by a firm during 2014-2018. What is the average expenditure per head of 2016 ?

View SolutionThe given bar chart shows production of steel by companies A, B, C and D for years 2014, 2015, 2016 (in tonnes).
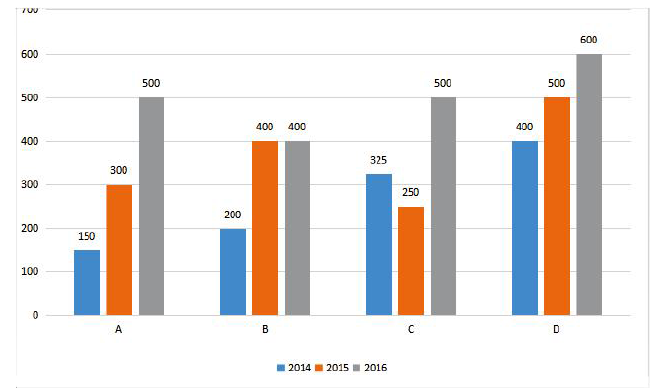
In the given bar-chart, the average production of steel at ‘C’ for the year 2014-2016 is:
View Solution
Knowledge Check
The table given below shows the revenue (in crores) of a company from years 2010 to 2016)
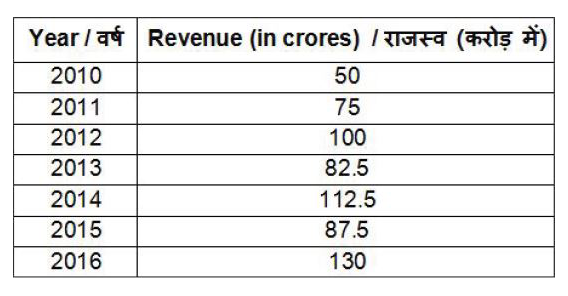
What is the average revenue (in crores) from year 2010 to 2014?Aa)85Bb)84Cc)90Dd)82.5The line chart given below shows the sales (in crores) of a company for the years 2009 to 2016
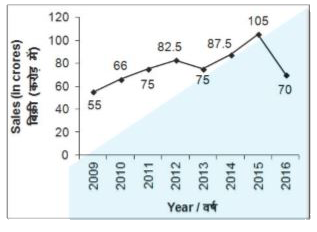
What is the percentage change in the company sales from year 2014 to year 2016?A20% increaseB20% decreaseC25% decreaseD22% decreaseThe bar graph given below shows the production (in000 tonnes) of rice of a country for the year 2007 to 2011 .
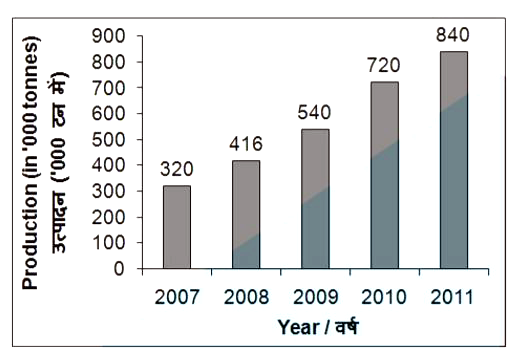
What is the average production of rice per year from 2009 to 2011 ?A700B550C860D900
The given bar chart shows production of steel by companies A , B , C and D for years 2014 ,2015, 2016
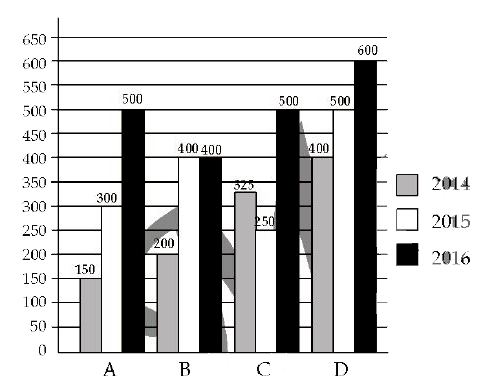
In the given pie chart, the average production of steel at C for the year 2014-2016 is:
View SolutionThe given Bar Graph presents the Revenue and Expenditure (in crores of Rupees ) of a company during the five year period , 2014 - 2018.
दिया गया दंड आरेख (bar graph) 5 वर्ष की अवधि 2014-2018 के दौरान किसी कंपनी के राजस्व और व्यय (करोड़ रुपए में ) को दर्शाता है।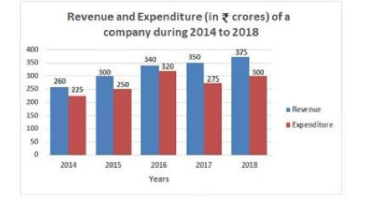
The expenditure of the company in 2017 is what percentage less than the average revenue ( per year ) in 2014, 2015 and 2016 ?
वर्ष 2017 में कंपनी का व्यय, वर्ष 2014, 2015 और 2016 में औसत राजस्व (प्रति वर्ष) से कितने प्रतिशत कम है?
View SolutionPer cent Profit =Income-ExpenditureExpenditure×100
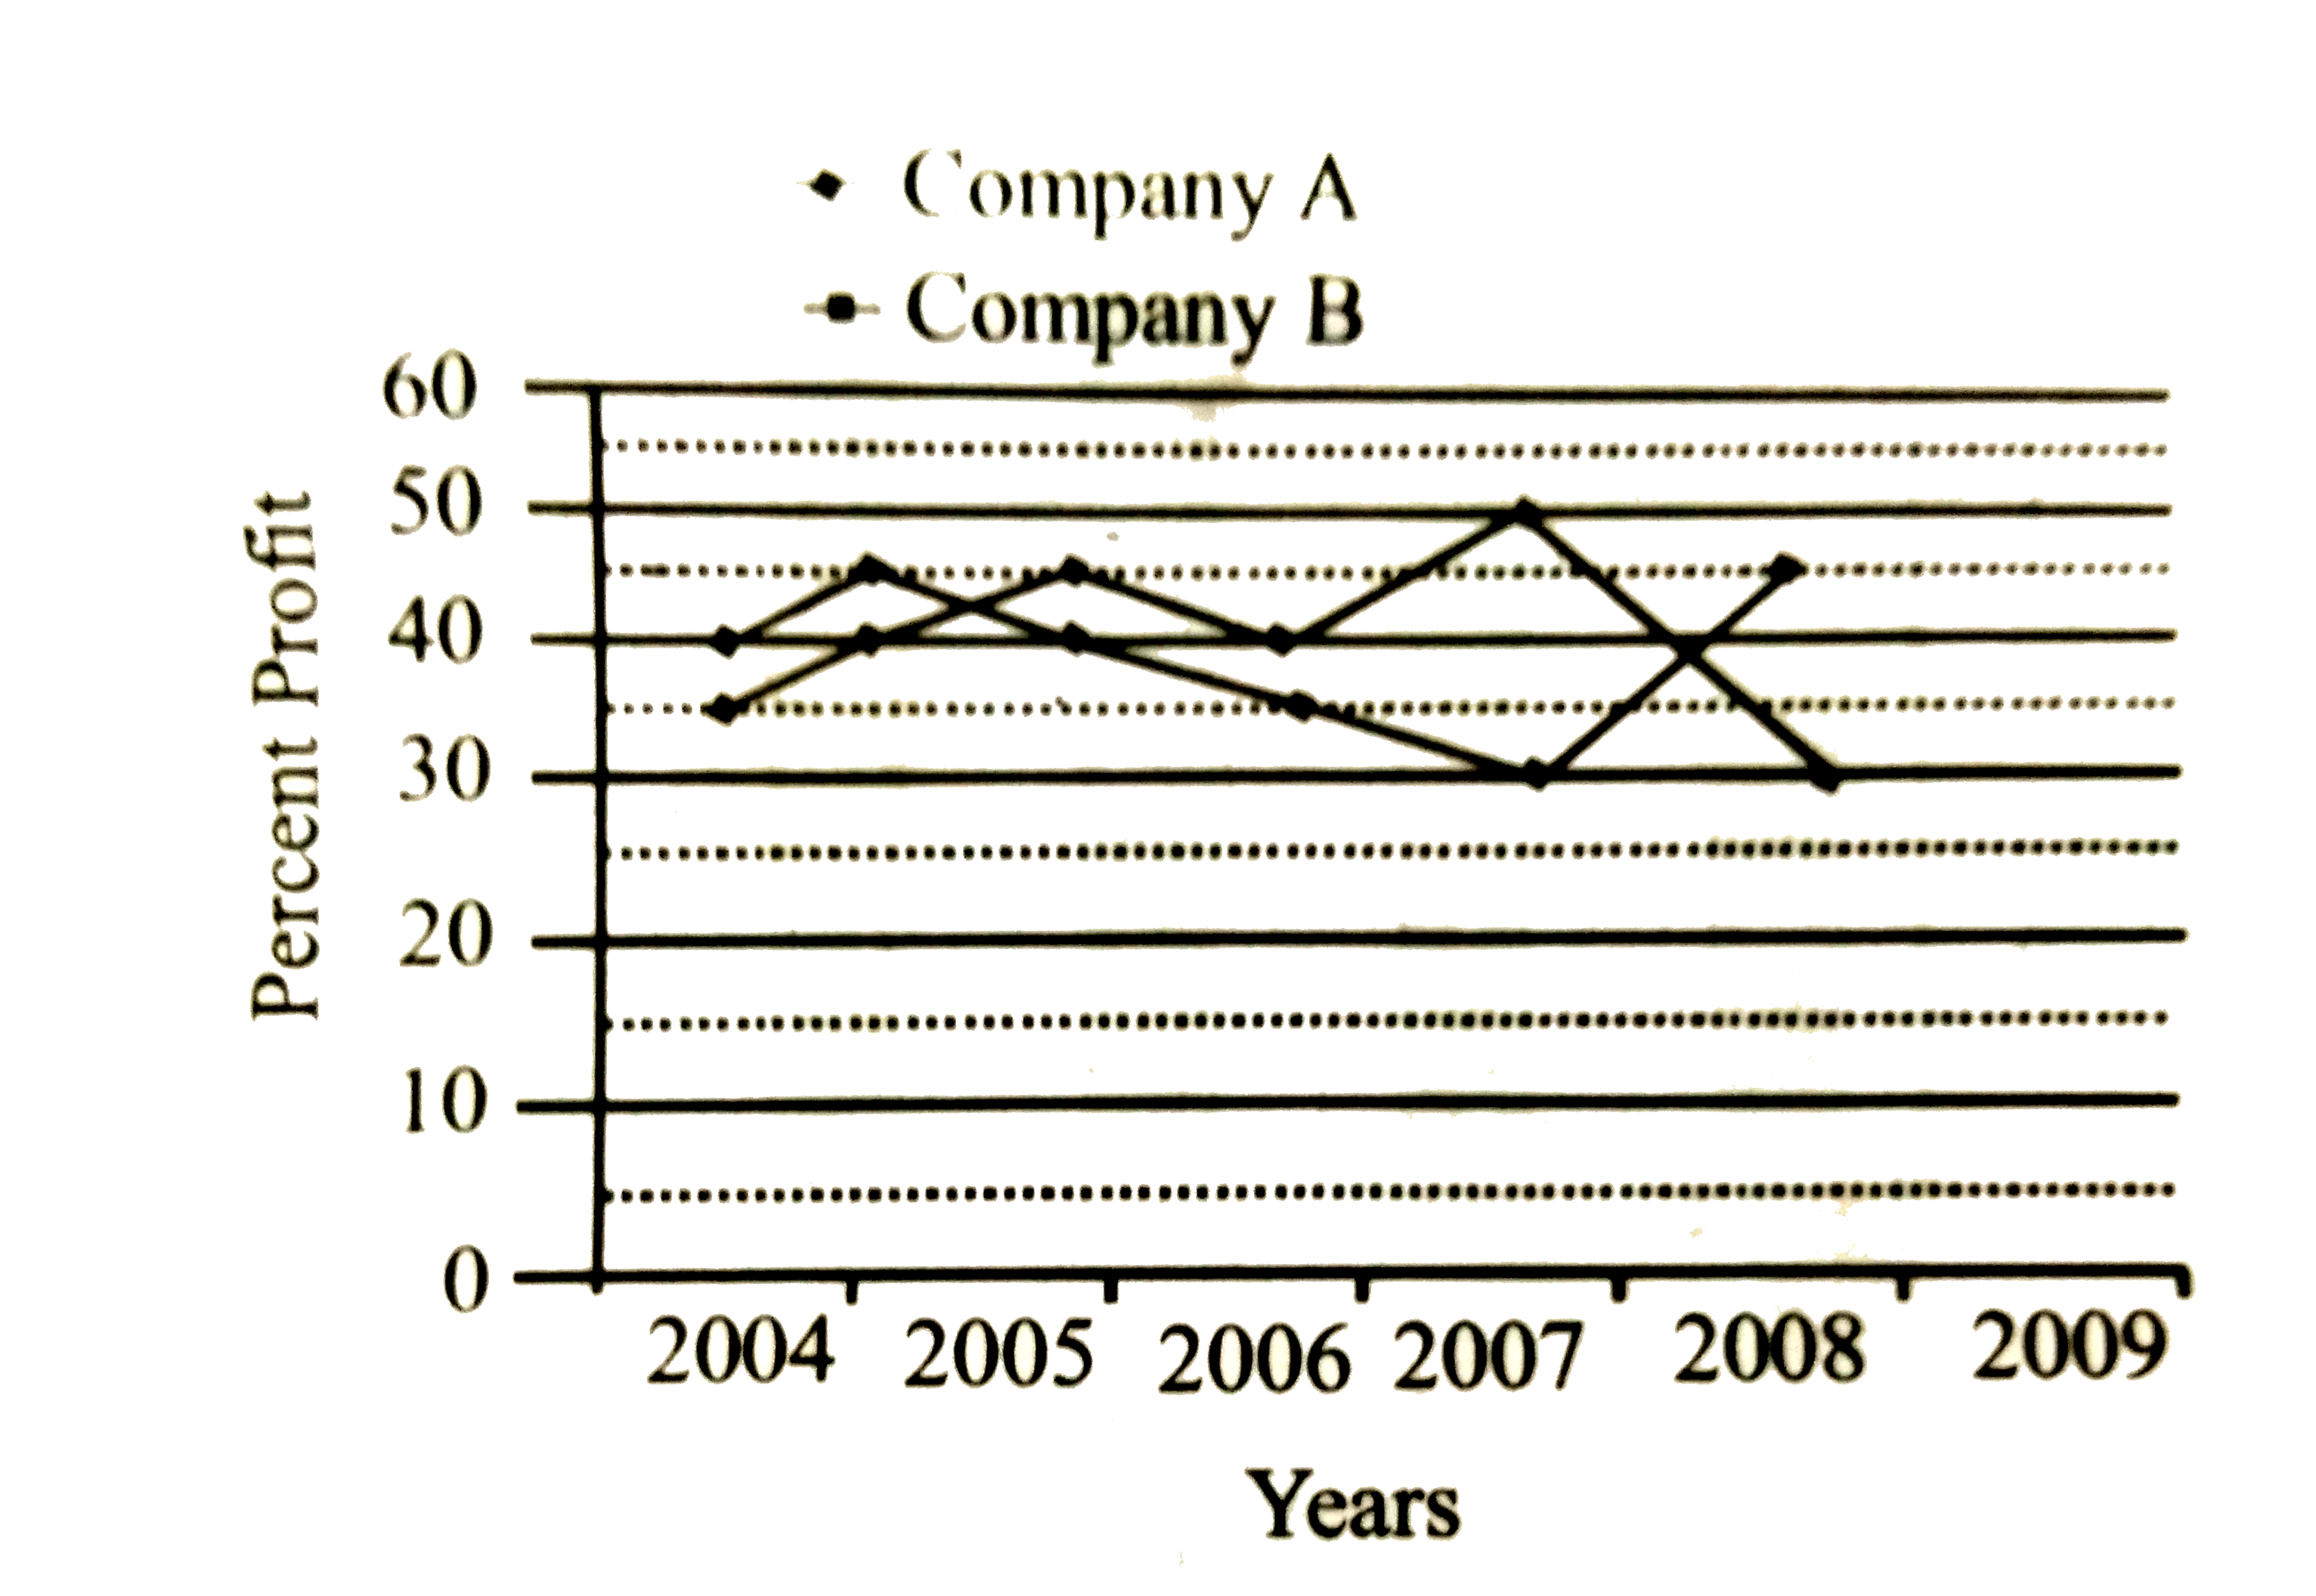
What is the average percent profit earned by Company B over all the years together?
View SolutionThe table given below shows the revenue (in crores) of a company from years 2010 to 2016)
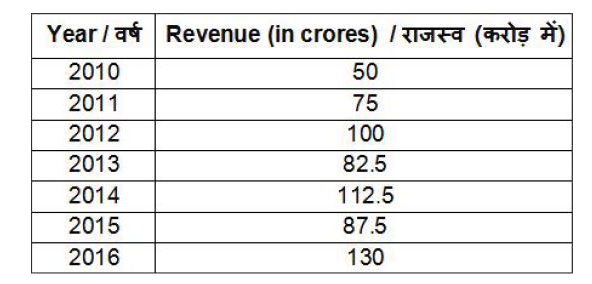
What is the percentage change in the revenue from year 2010 to 2014?
View SolutionThe line chart given below shows the number of students in 2 sections X and Y from year 2009 to 2016.
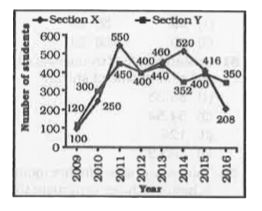
What is the average number of students in section X from year 2009 to year 2014?
View Solution
