Refer to the graph and answer the given questions.
Number of students who opted for 2 courses A and B from 2010 to 2014
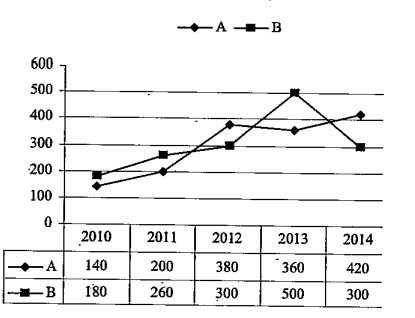
In 2014, if ‘X’ students passed Courses A and B each and the ratio of the number of students who failed in Courses A and B respectively was 5:2, what is the value of X
190
220
160
150
The correct Answer is:B
Step by step video, text & image solution for Refer to the graph and answer the given questions. Number of students who opted for 2 courses A and B from 2010 to 2014 In 2014, if ‘X’ students passed Courses A and B each and the ratio of the number of students who failed in Courses A and B respectively was 5:2, what is the value of X by Maths experts to help you in doubts & scoring excellent marks in Class 14 exams.
Similar Questions
100 students appeared in annual exami-nation. 60 students passed. The ratio of the number of students who failed to the total number of students is
View SolutionThe following bar graph shows the number of students (in hundreds) who have opted for different courses A, B, C and D in 3 years in a college. Study the graph and answer the question.
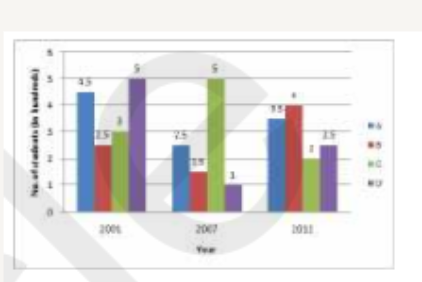 What is the ratio of the number of students who were admitted to course A in the year 2007 to that
of students who were admitted to course C in the year 2012? View Solution
Knowledge Check
- Question 1 - Select One
The line chart given below shows the number of students who have taken admission in college A and B from the years 2010 to 2015 .
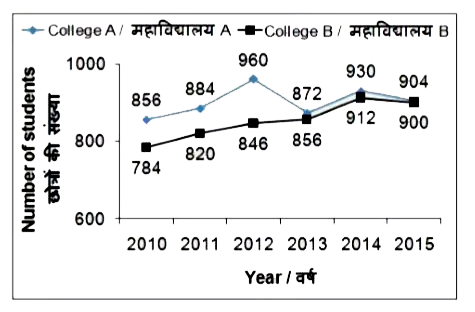
What is the average difference of number of students in college A and B in the given period?A24B48C96D144 - Question 2 - Select One or More
The table given below shows the number of students admitted in 2 sections X and Y from year 2011 to 2015.
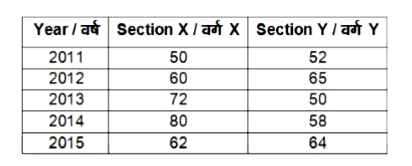
What is the percentage change in the number of students admitted in section Y from year 2011 to 2014?A13.81B11.54C6D58 - Question 3 - Select One
The table given below shows the number of students who have taken admission in school A and B from the years 2010 to 2015.
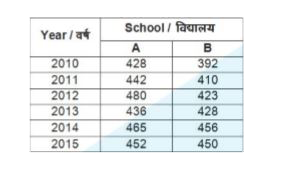
What is the average difference of number of students in school A and B in the given period?Aa)24Bb)27Cc)96Dd)144
The performance of 720 students in an examination for the academic year 2015-16 is shown in a pie chart. Study the pie chart carefully and answer the questions that follow.
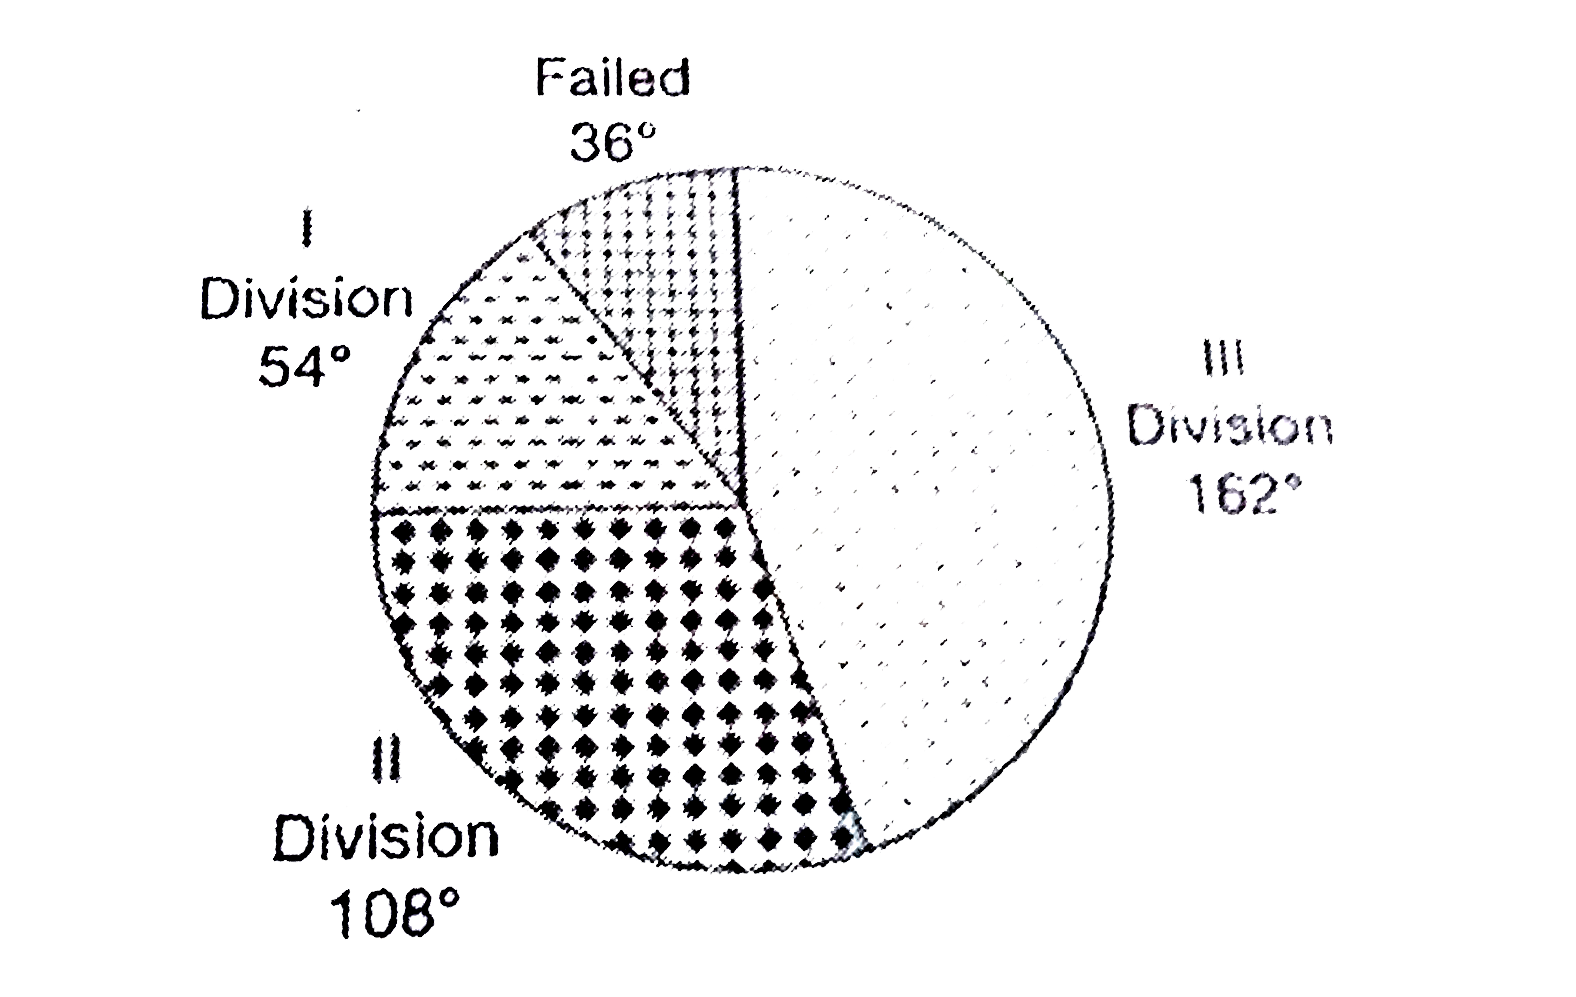
(i) Find the number of students who passed in the first division.
(ii) Find the ratio of number of students who passed to that of failed.
(iii) Find the pecentage of the number of students who failed in the examination.View SolutionThe line chart given below shows the number of students who have taken admission in college A and B from the years 2010 to 2015 .
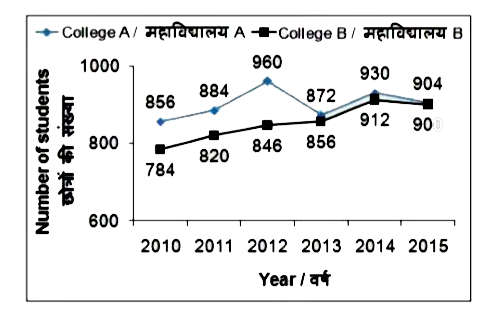
In how many years, the number of students in college A is less than the average number of students in college B across all the years?View Solution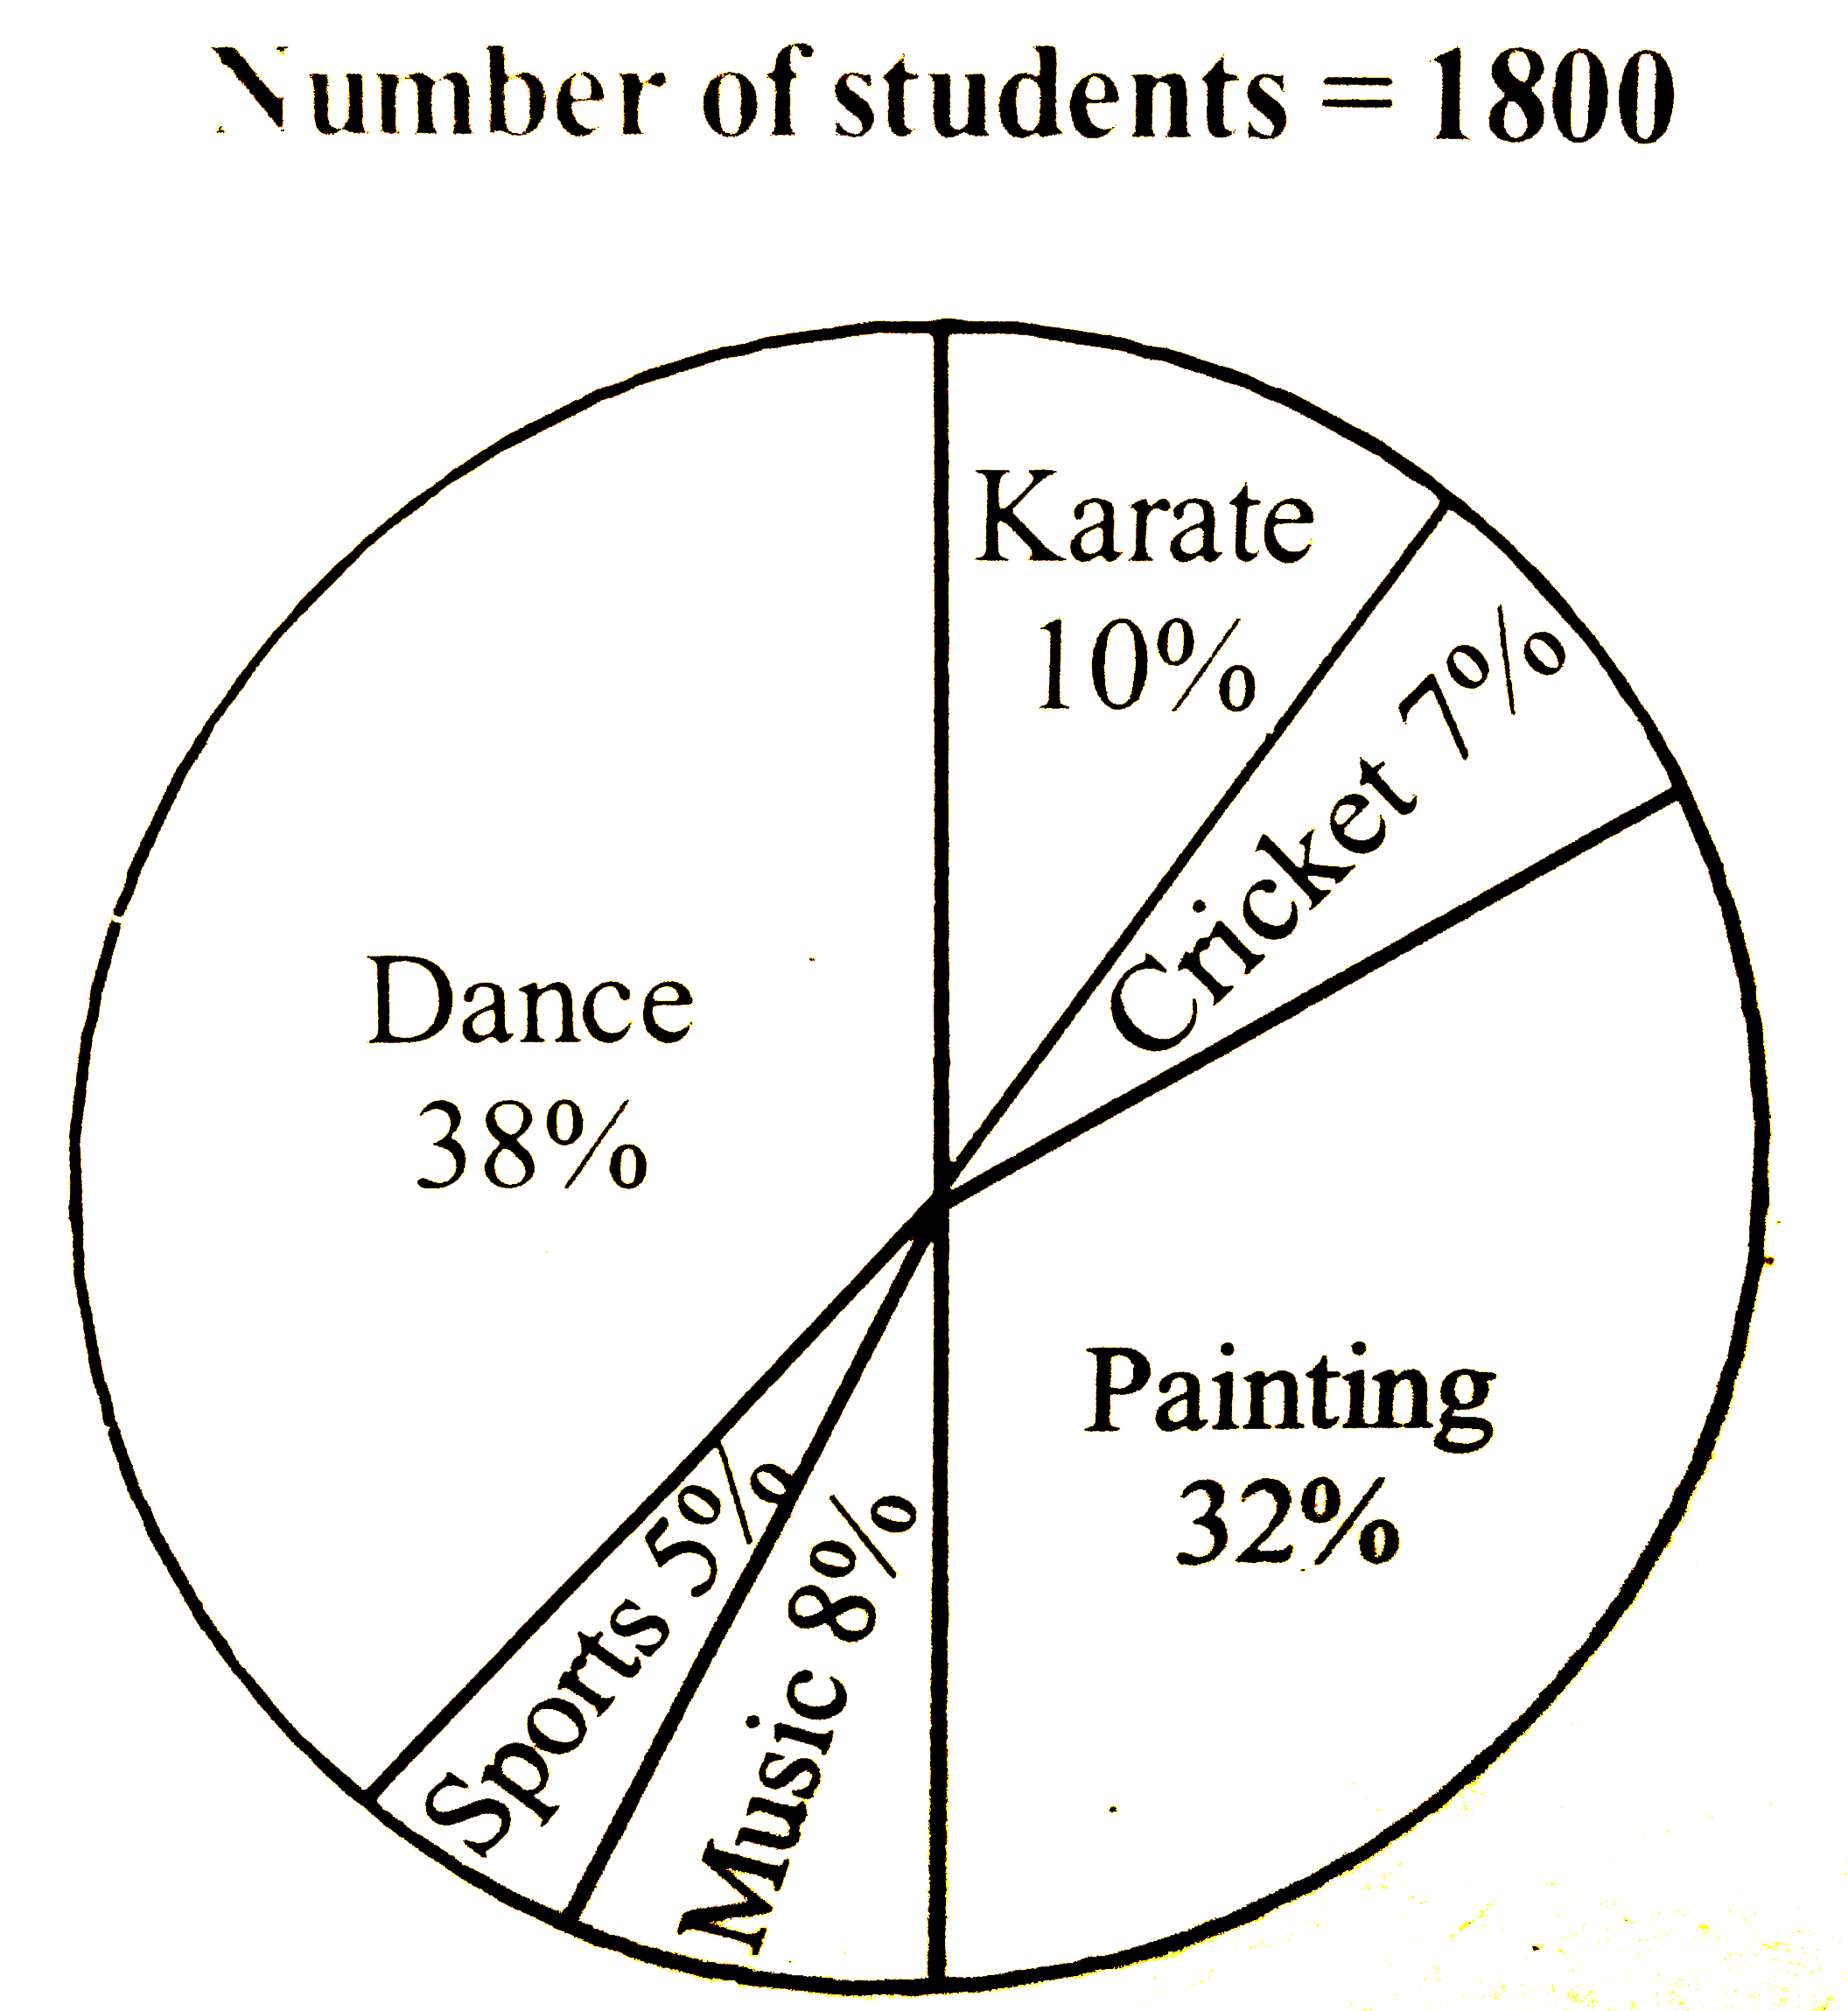
What is the respective ratio between the number of students who opted for painting and that who opted for Karate ?View Solution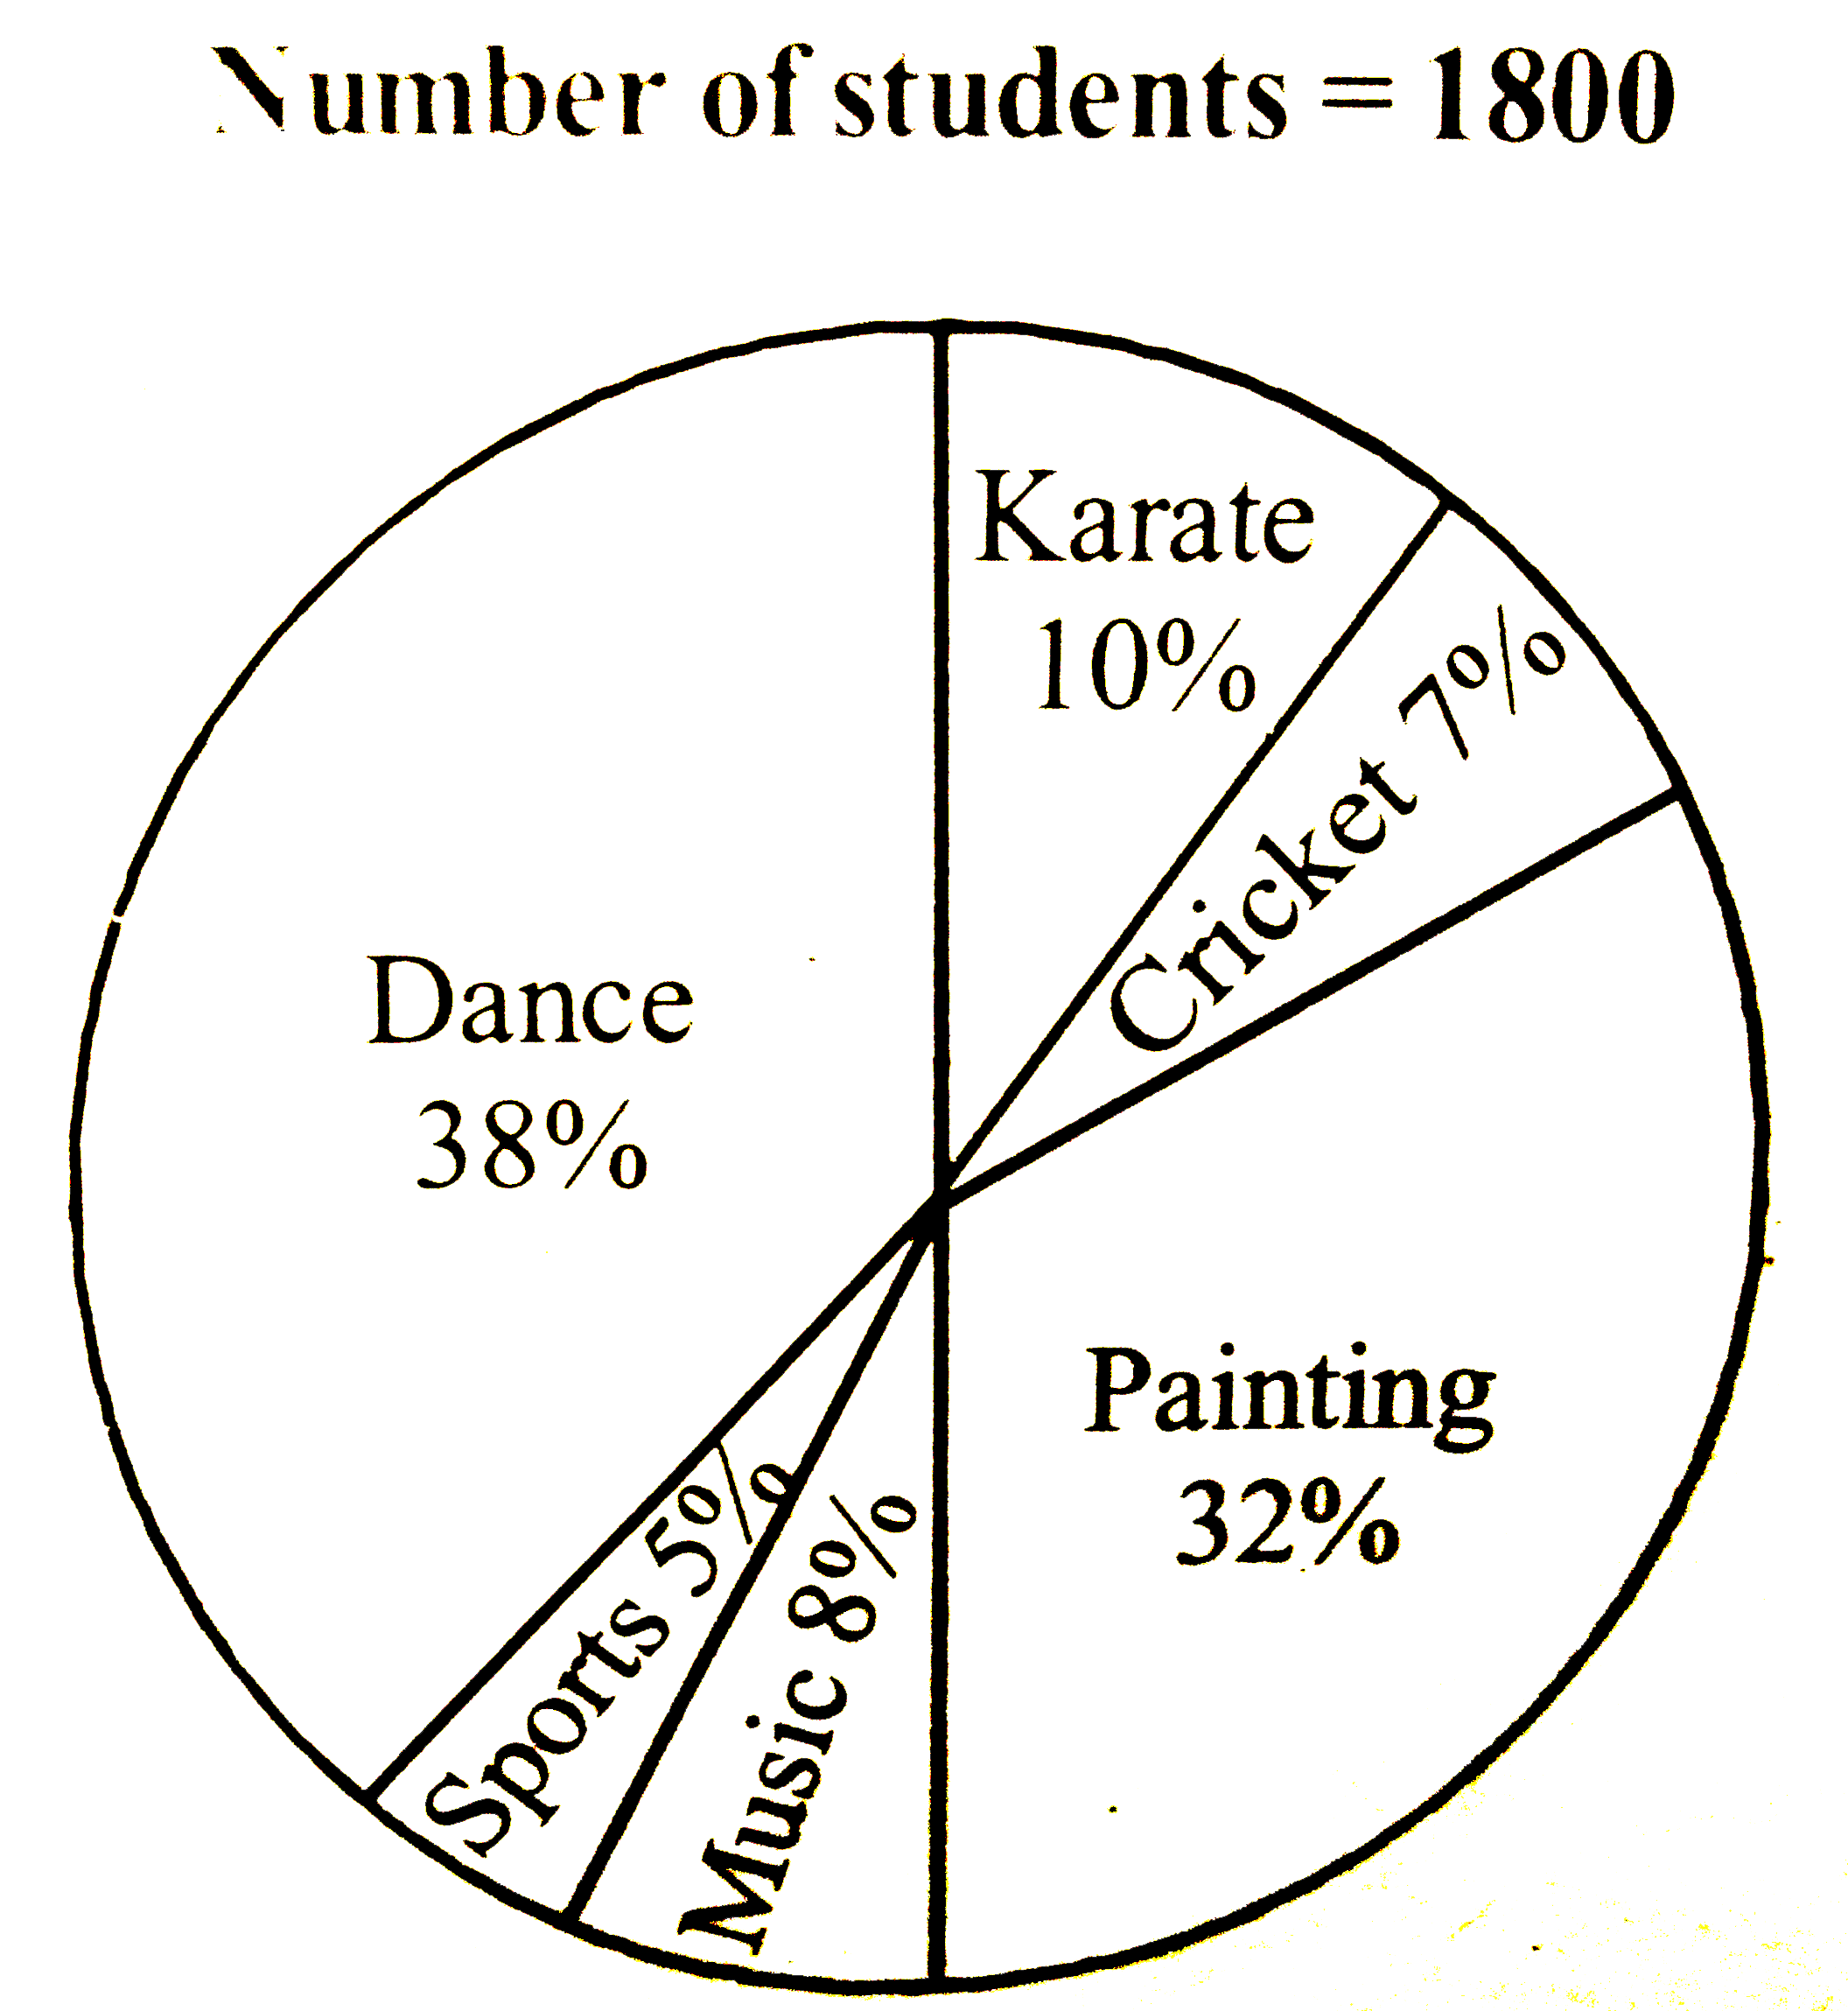
What is the respective ratio between the number of students who opted for dancing and karate who opted for paintingView SolutionStudy the following table and answer question.
Number of students appeared in an examination from five citie s:
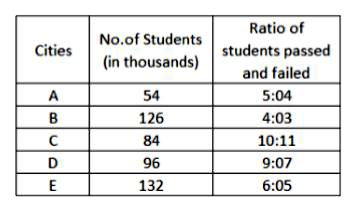
The total number of students who appeared in the examination from cities C and D is what percent more than the total number of students who failed in cities A, B and E ? (nearest to an integer)View Solution
