Study the table and answer the given questions.
The following data are regarding number of shoes sold by five shops -A, B, C, D and E - in five different months - July August,- September, October and November.
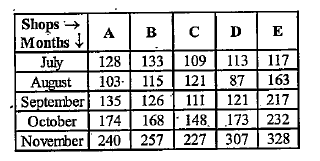
What is the ratio of the total number of shoes sold by shop B in October and November together to the total number of shoes sold by shop C in the same months together?
19:17
19:15
17:15
15:17
The correct Answer is:C
Step by step video, text & image solution for Study the table and answer the given questions. The following data are regarding number of shoes sold by five shops -A, B, C, D and E - in five different months - July August,- September, October and November. What is the ratio of the total number of shoes sold by shop B in October and November together to the total number of shoes sold by shop C in the same months together? by Maths experts to help you in doubts & scoring excellent marks in Class 14 exams.
Updated on:21/07/2023Similar Questions
Knowledge Check
The given table represents the sale (in thousands) of cars by four companies A,B,C and D in six years. Study the table and answer the questions that follow:
दी गयी तालिका चार कंपनियों - A, B, C और D के द्वारा छः वर्षों में की गयी कारों की बिक्री ( हज़ार में ) दर्शाती है | इस तालिका का अध्ययन करें तथा फिर पूछे गए प्रश्नों के उत्तर दें |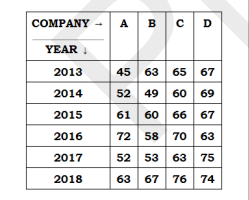 What is the ratio of total number of cars sold by companies A,B and D in 2017 to the total number
of cars sold by all companies in 2018?
कंपनी A, B और D के द्वारा 2017 में बेची गयी कारों की कुल संख्या तथा 2018 में सभी कंपनियों के द्वारा बेची गयी कारों की कुल संख्या के बीच क्या अनुपात है ?A3:4B6:13C9:14D18:23The given table represents the number of computers sold by four dealers A,B, C and D during the first six months of 2016. Study the table carefully and answer the questions that follows:
दी गयी तालिका चार विक्रेताओं A, B, C और D के द्वारा 2016 के पहले छः महीनों में बेचे गए कंप्यूटरों की संख्या दर्शाती है | इस तालिका का ध्यानपूर्वक अध्ययन करें तथा पूछे गए प्रश्नों का उत्तर दें |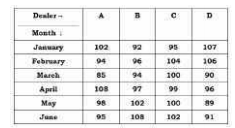 What is the ratio of the total number of computers sold by dealer A in February, April and May to the total number of computers sold by dealer D in March, May and June? /
विक्रेता A के द्वारा फरवरी, अप्रैल और मई में बेचे गए कंप्यूटरों की कुल संख्या तथा विक्रेता D के द्वारा मार्च, मई और जून में बेचे गए कंप्यूटरों की कुल संख्या के बीच क्या अनुपात है ?A15:13B10:9C6:5D20:27The table below depicts the Number of Books Sold by 5 cities during 5 months . Study the following table and answer the question .
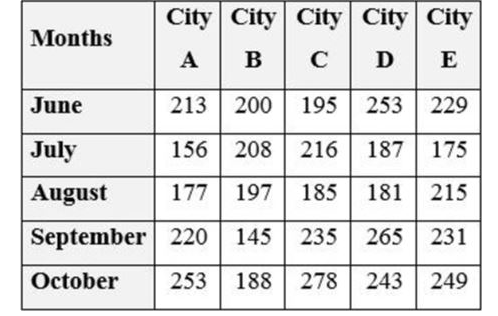
What is the respective ratio between the total number of books sold by City A in July and September together and total number of books sold by City E in August and October together ?
(a)57:49
(b)49:57
(c)58:47
(d)47:58A57:49B49:57C58:47D47:58
Direction: The given bar graph shows the number of pens sold by two shops A & B in four consecutive months. Study the following data and answer the following questions:
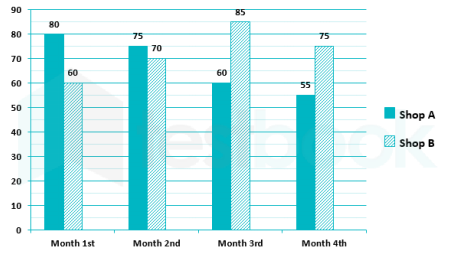
Find the ratio of the number of pens sold by shop A in months 1st and 3rd together to the number of pens sold by shop B in months 2nd and 4th together.
View SolutionDirections: Refer to the following graph and answer the given questions. Data related to the number of shoes sold by two stores (A and B )during five years:
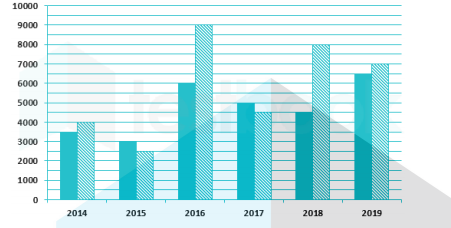
What is the difference between the total number of shoes sold by store A in 2018 and 2019 together and the total number of shoes sold by store B in 2014 and 2015 together?
View SolutionDirections: Refer to the following graph and answer the given questions. Data related to the number of shoes sold by two stores (A and B )during five years:
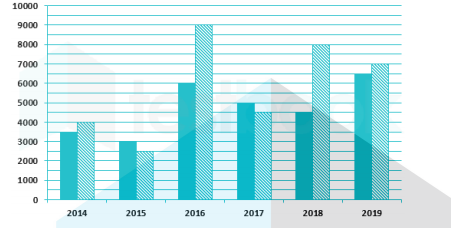
Find the ratio between the total number of shoes sold by stores A and B together in 2016 to the total number of shoes sold by stores A and B together in 2018?
View SolutionDirections: Refer to the following graph and answer the given questions. Data related to the number of shoes sold by two stores (A and B )during five years:
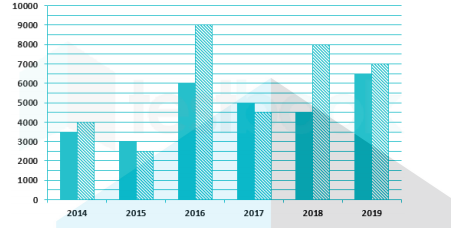
If the respective ratio between the total number of shoes sold by stores A and B together in 2014 and that in 2020 is 5 : 7.What is the total number of shoes sold by stores A and B together in 2020?
View SolutionDirection: Study the data carefully and answer the following questions.
Following is the data given of selling of 5 shops A, B, C, D and E of two different types of books.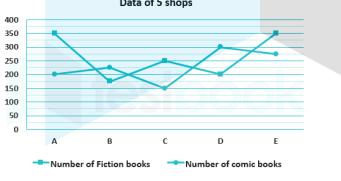
Number of comic books sold from shop E is what % more than number of comic books sold from shop A?
View Solution


