Study the table and answer the given questions.
The following data are regarding number of shoes sold by five shops -A, B, C, D and E - in five different months - July August,- September, October and November.
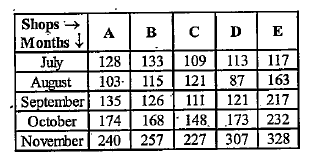
The number of shoes. sold by shop E in September was approximately what per cent more than the number of shoes sold by shop B in the same month?
60
65
78
72
The correct Answer is:D
Step by step video, text & image solution for Study the table and answer the given questions. The following data are regarding number of shoes sold by five shops -A, B, C, D and E - in five different months - July August,- September, October and November. The number of shoes. sold by shop E in September was approximately what per cent more than the number of shoes sold by shop B in the same month? by Maths experts to help you in doubts & scoring excellent marks in Class 14 exams.
Updated on:21/07/2023Similar Questions
Study the pie chart and answer the question
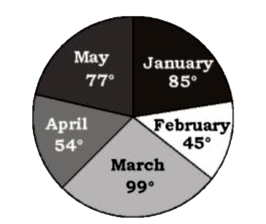
The total number of computers sold in February and April is what percentage more than the number of computers sold in May
View Solution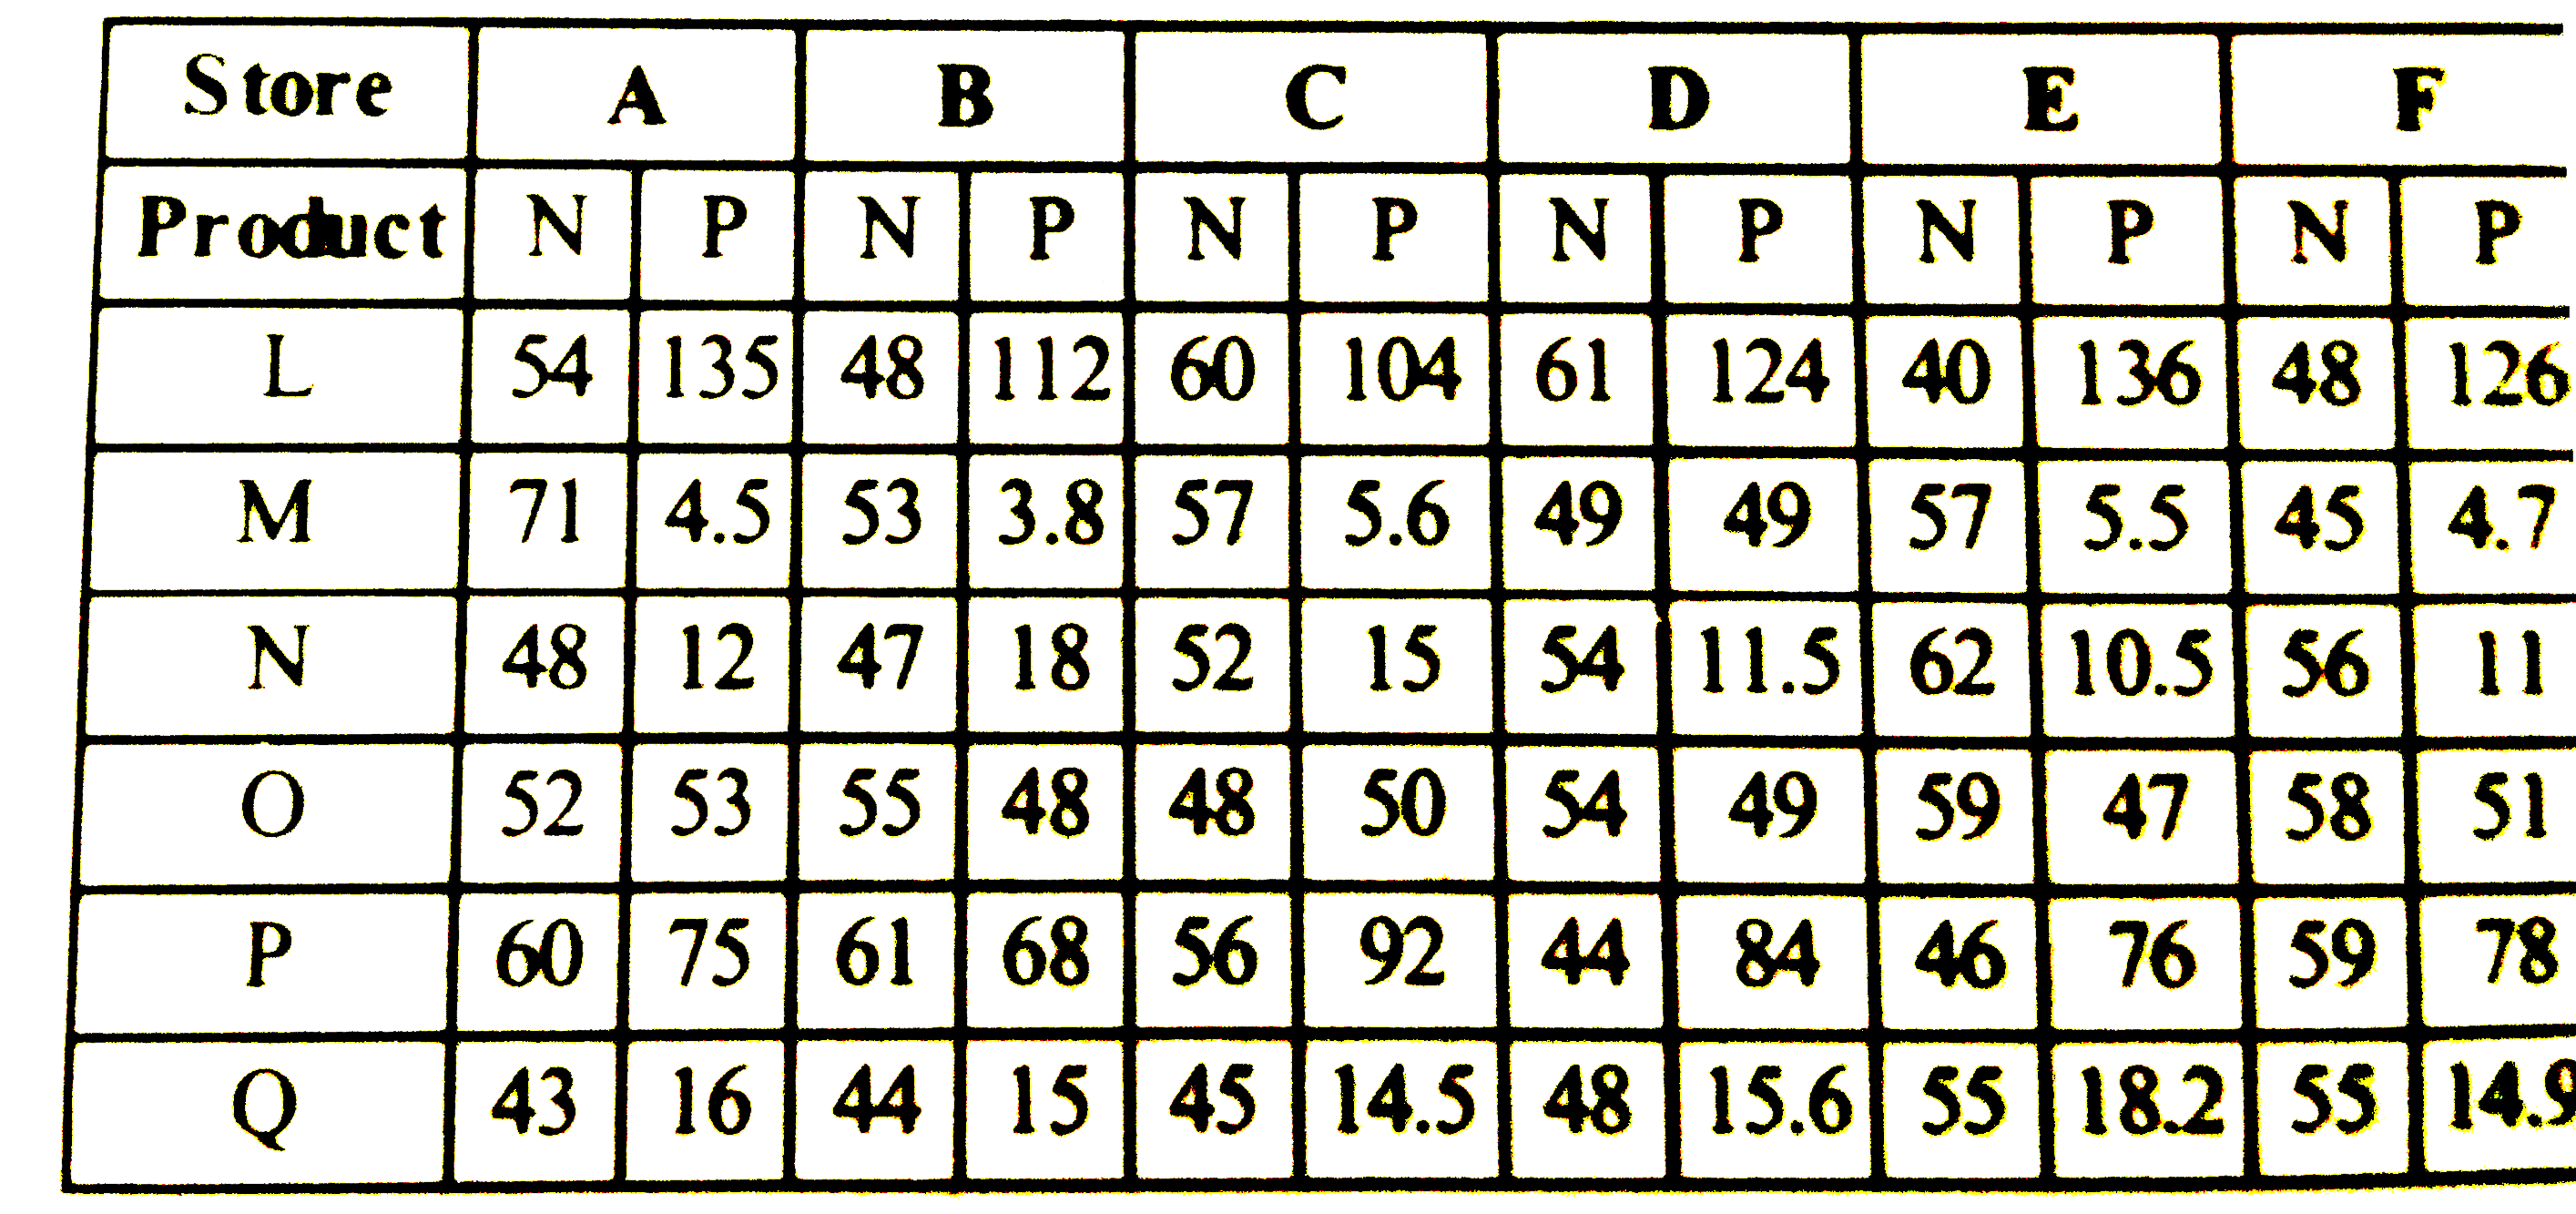
The number of L type products sold by Store F is what per cent of the number of the same tyep of products sold by Store E ?
View Solution
Knowledge Check
Study the table carefully to answer the questions that follow-
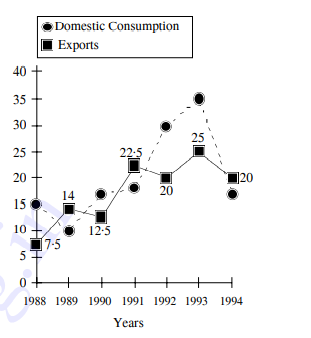
What is the approximate average number of units sold in the year 1999?A407300000B4040000C42740000D4073000000The number of tickets of movie B sold in Hyderabad was approximately, what per cent of the total number of tickets of the same movie sold in all the cities together?
A15B24C12D20
Direction: The given bar graph shows the number of pens sold by two shops A & B in four consecutive months. Study the following data and answer the following questions:
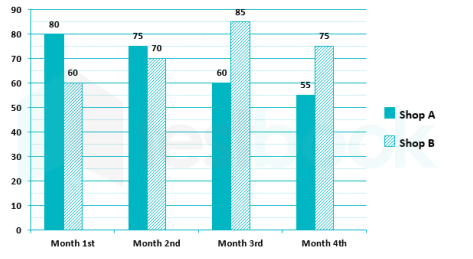
Find that the number of pens sold by shop A in 1st month is how much percent more than the number of pens sold by shop A in 3rd month.
View SolutionDirection: Study the data carefully and answer the following questions.
Following is the data given of selling of 5 shops A, B, C, D and E of two different types of books.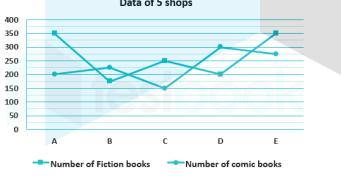
Find the average of total number of fictions books sold from all the 5 shops.
View SolutionDirection: Study the data carefully and answer the following questions.
Following is the data given of selling of 5 shops A, B, C, D and E of two different types of books.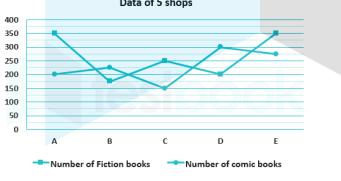
Number of comic books sold from shop E is what % more than number of comic books sold from shop A?
View SolutionDirections: Refer to the following graph and answer the given questions. Data related to the number of shoes sold by two stores (A and B )during five years:
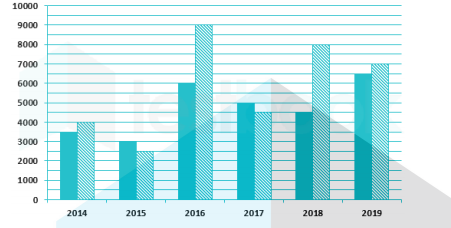
What is the difference between the total number of shoes sold by store A in 2018 and 2019 together and the total number of shoes sold by store B in 2014 and 2015 together?
View SolutionDirection: Study the data carefully and answer the following questions.
Following is the data given of selling of 5 shops A, B, C, D and E of two different types of books.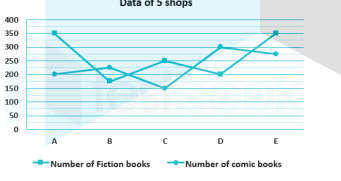
Find the difference between number of fiction books sold from shop B to number of comic books sold from shop D.
View SolutionDirection: Study the data carefully and answer the following questions.
Following is the data given of selling of 5 shops A, B, C, D and E of two different types of books.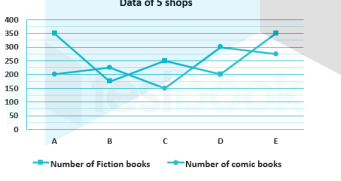
Find the ratio between total books sold from shop C to that of shop B.
View Solution
