Refer to the graph and answer the given questions
Data regarding the number of students opting for one of the five games at a Sports Academy (having a total strength of 1400 students)
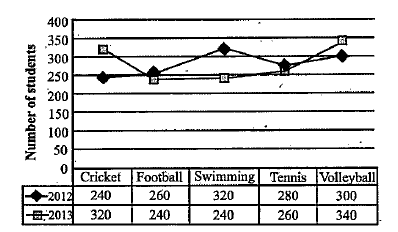
What is the respective ratio between the total number of students opting for Cricket in 2012and 2013 together and those opting for Volleyball in the same years together ?
6:7
8:9
7:8
4:3
The correct Answer is:C
Step by step video, text & image solution for Refer to the graph and answer the given questions Data regarding the number of students opting for one of the five games at a Sports Academy (having a total strength of 1400 students) What is the respective ratio between the total number of students opting for Cricket in 2012and 2013 together and those opting for Volleyball in the same years together ? by Maths experts to help you in doubts & scoring excellent marks in Class 14 exams.
Updated on:21/07/2023Similar Questions
Knowledge Check
Study the following graph and answer the questions given below :
No. of students (in thousands) who opted for three different specializations during the given five years in a University
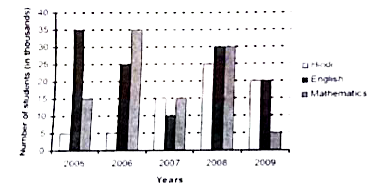
What is the respective ratio between the number of students who opted for English in the years 2006 and 2008 together and the number of students who opted for Hindi in the year 2005 and 2009 together ?A11:5B12:7C11:7D12:5If in the pie chart representing the number of students opting for different streams of study out of a total strength of 1650 students , the central angle of the sector representing arts students is 48∘ then what is the number of students who opted for arts stream ?
A220B240C275D320Study the following graph carefully to answer the questions that follow-----
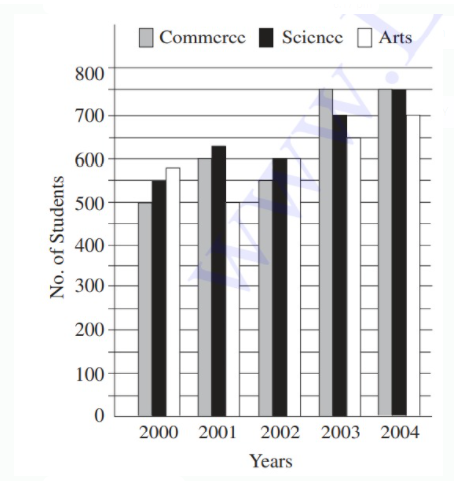
What is the respective ratio of total number of students studying Arts,Commerce and Science in all the years together ?A77 : 75 : 76B76 : 75 : 77C76 : 77 : 75D75 : 77 : 76
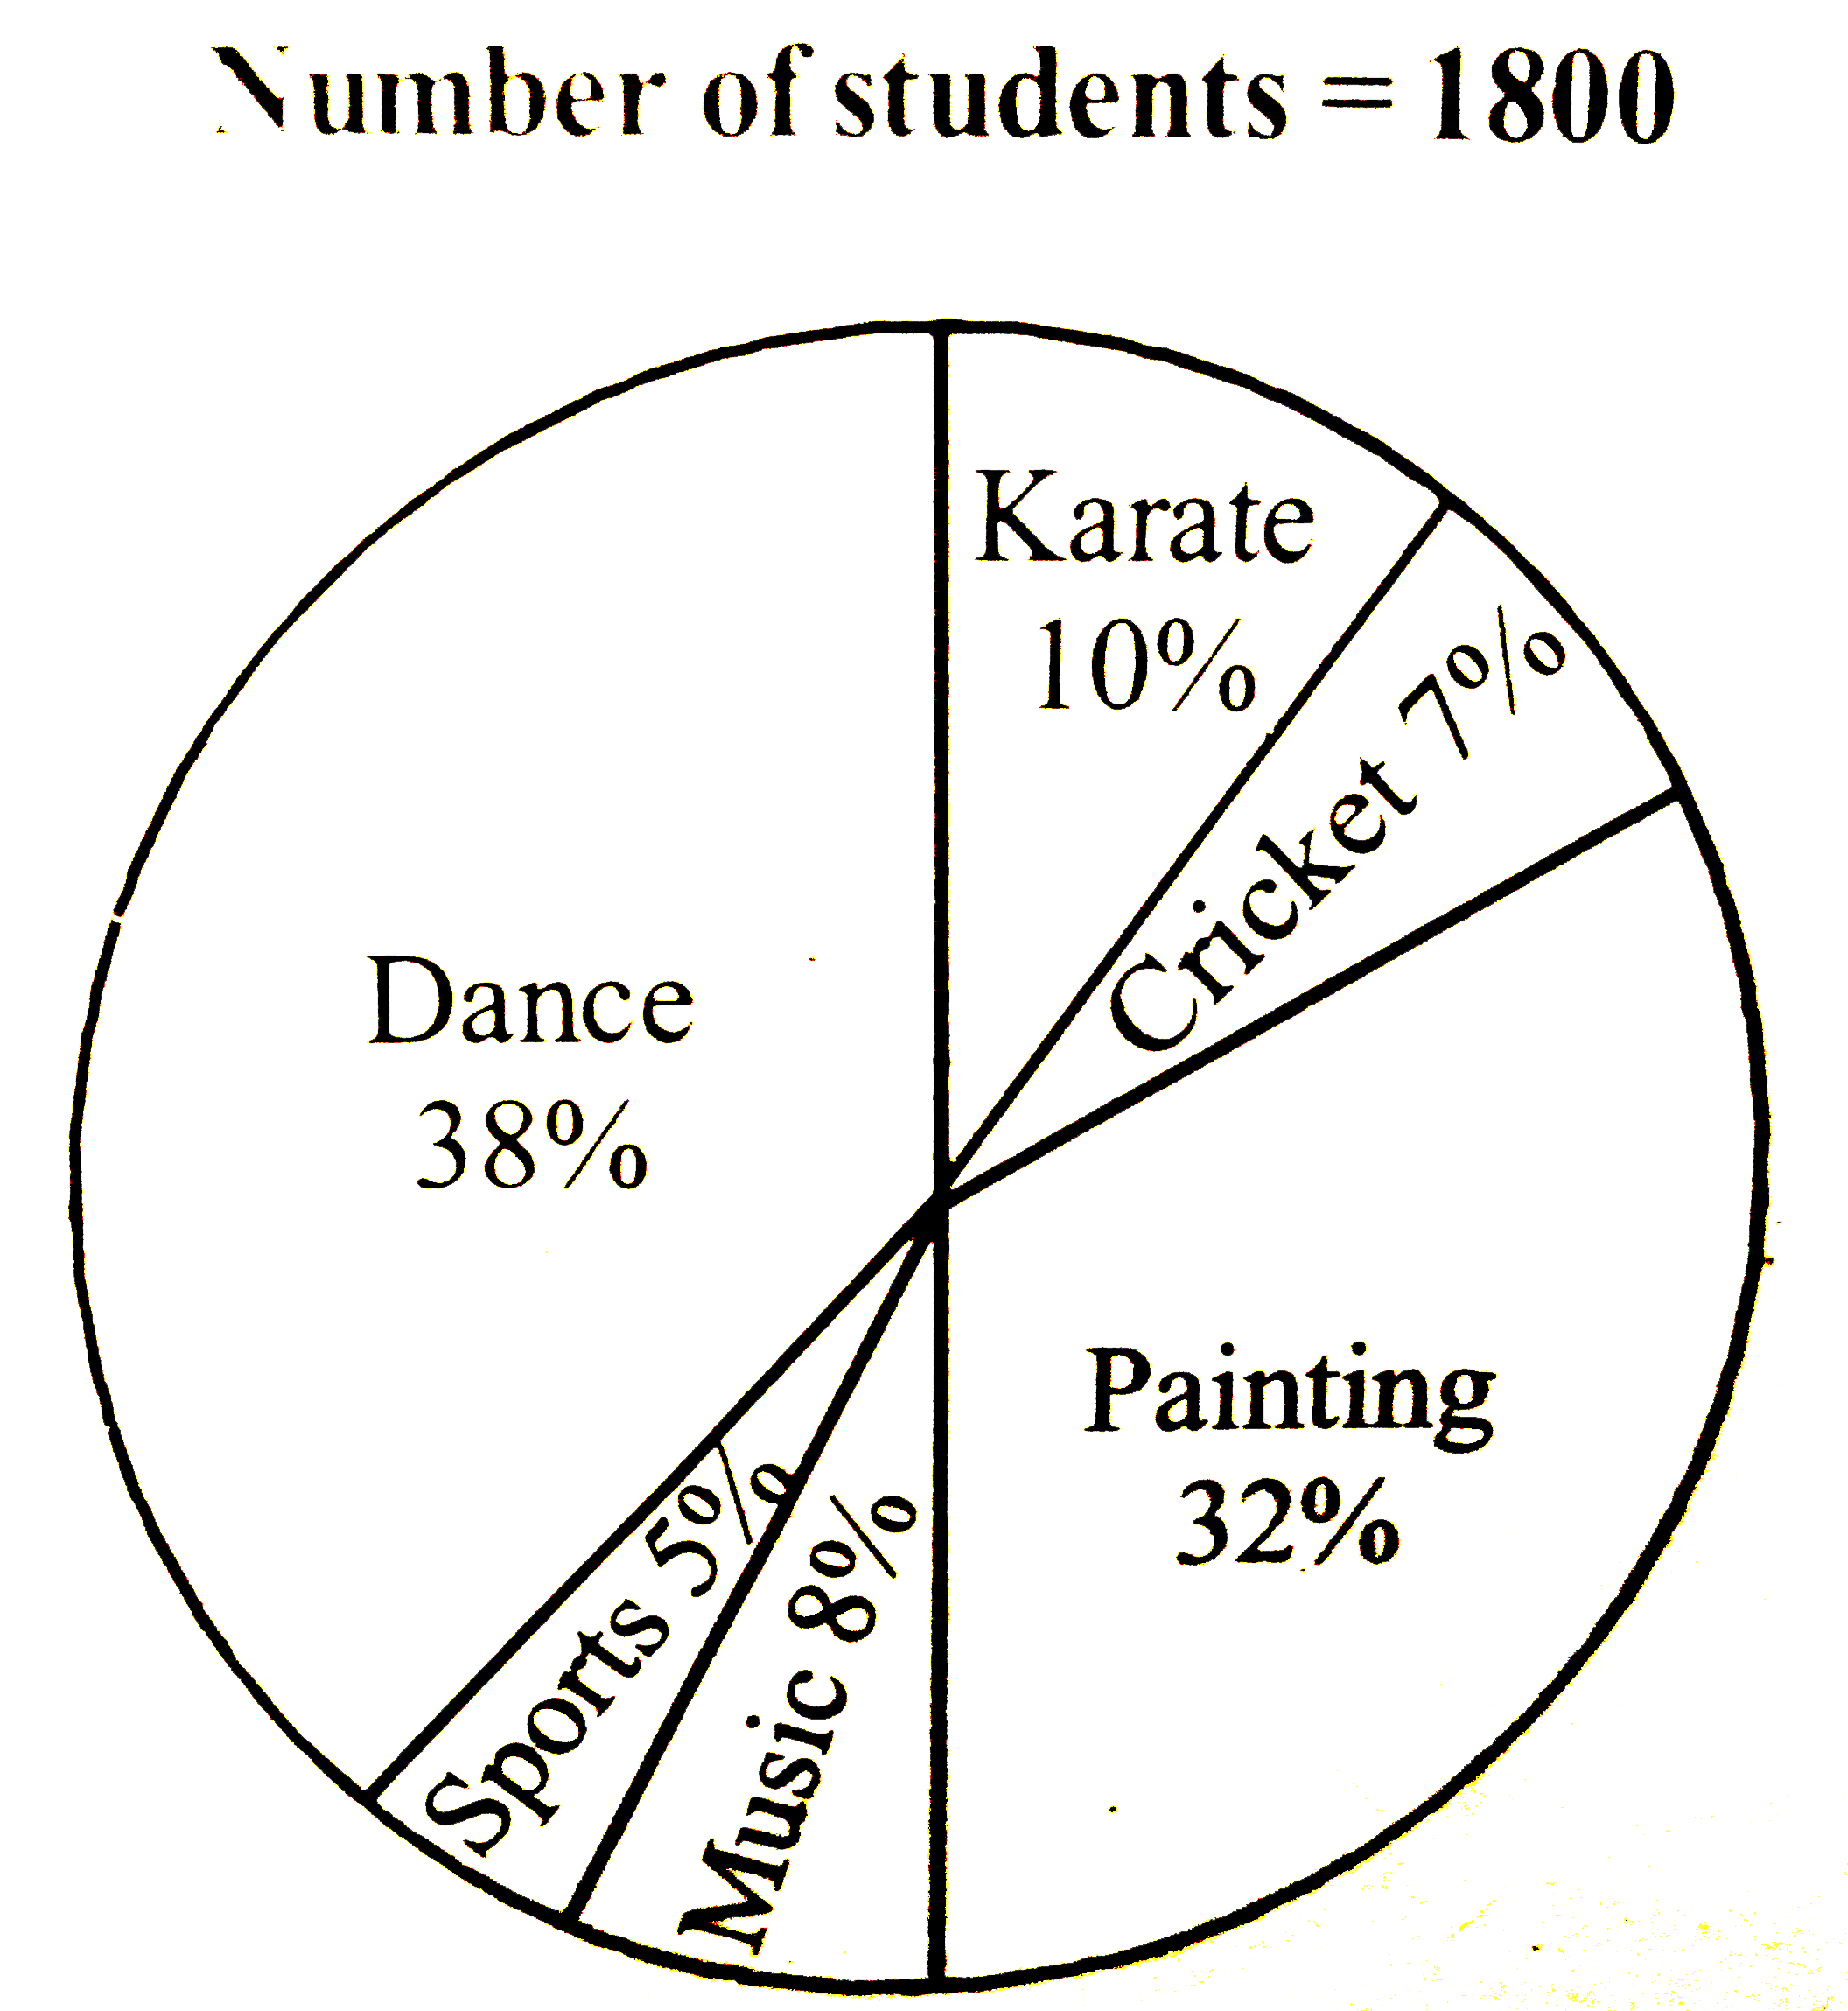
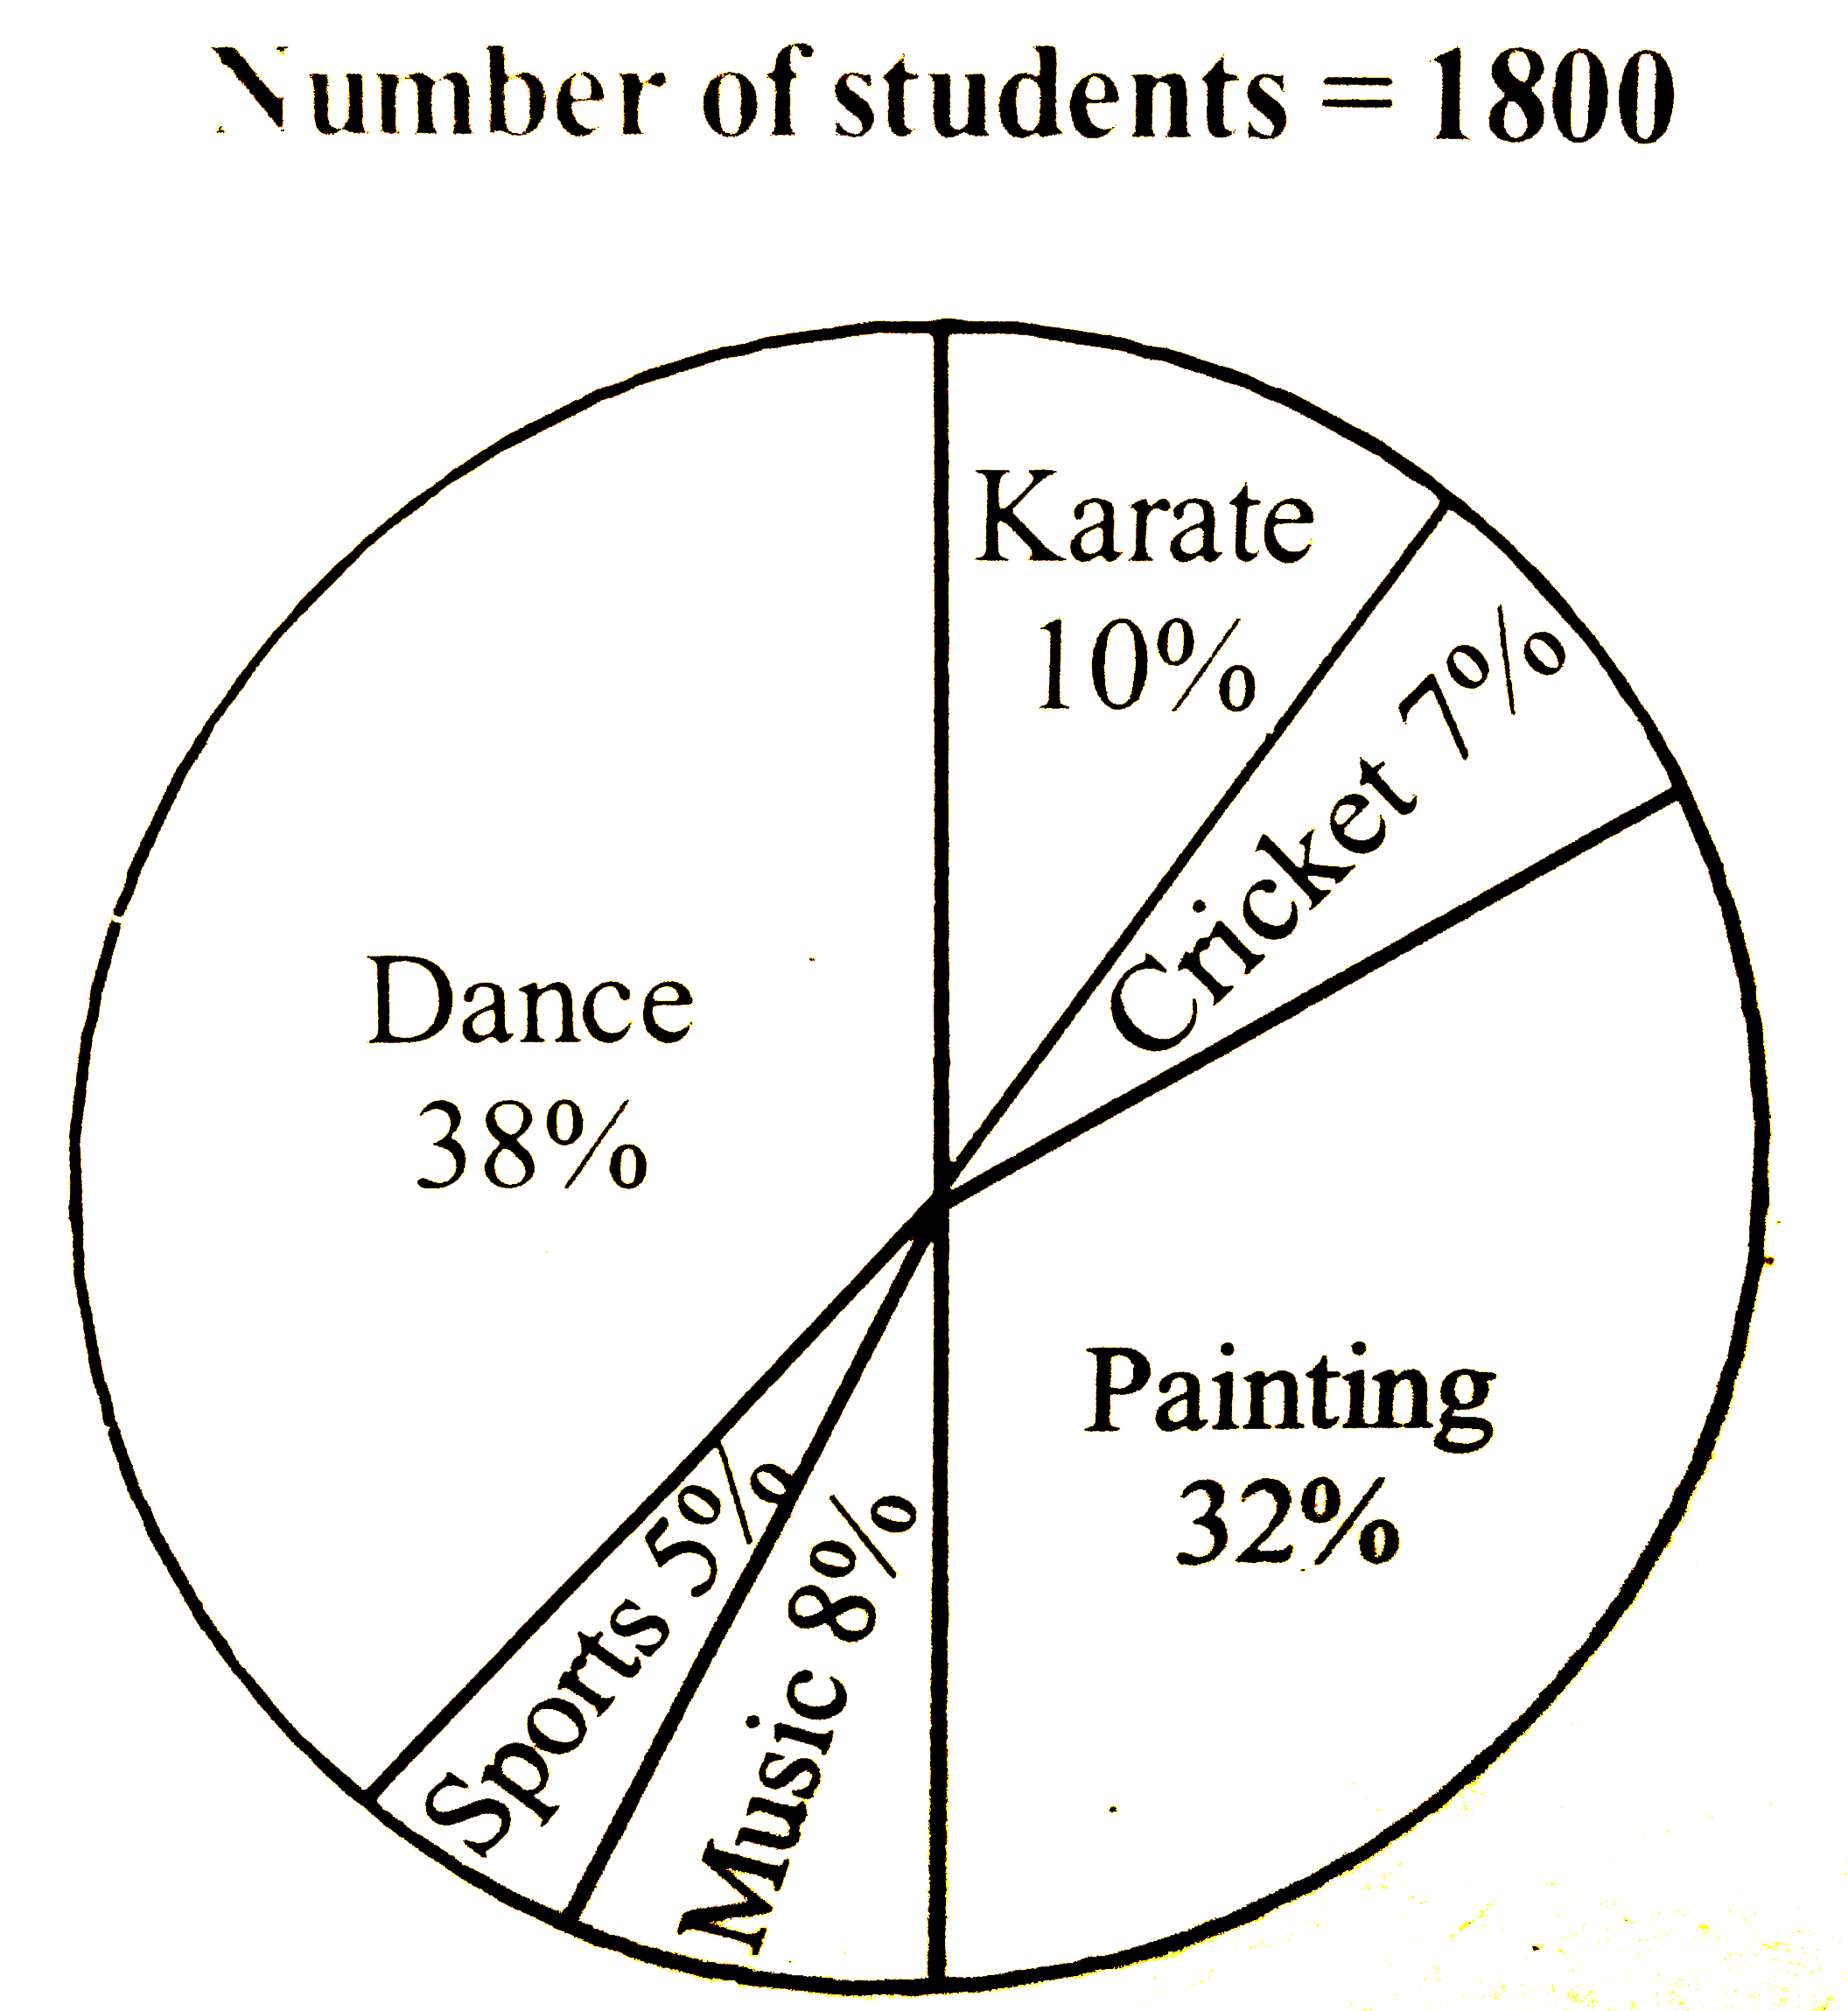
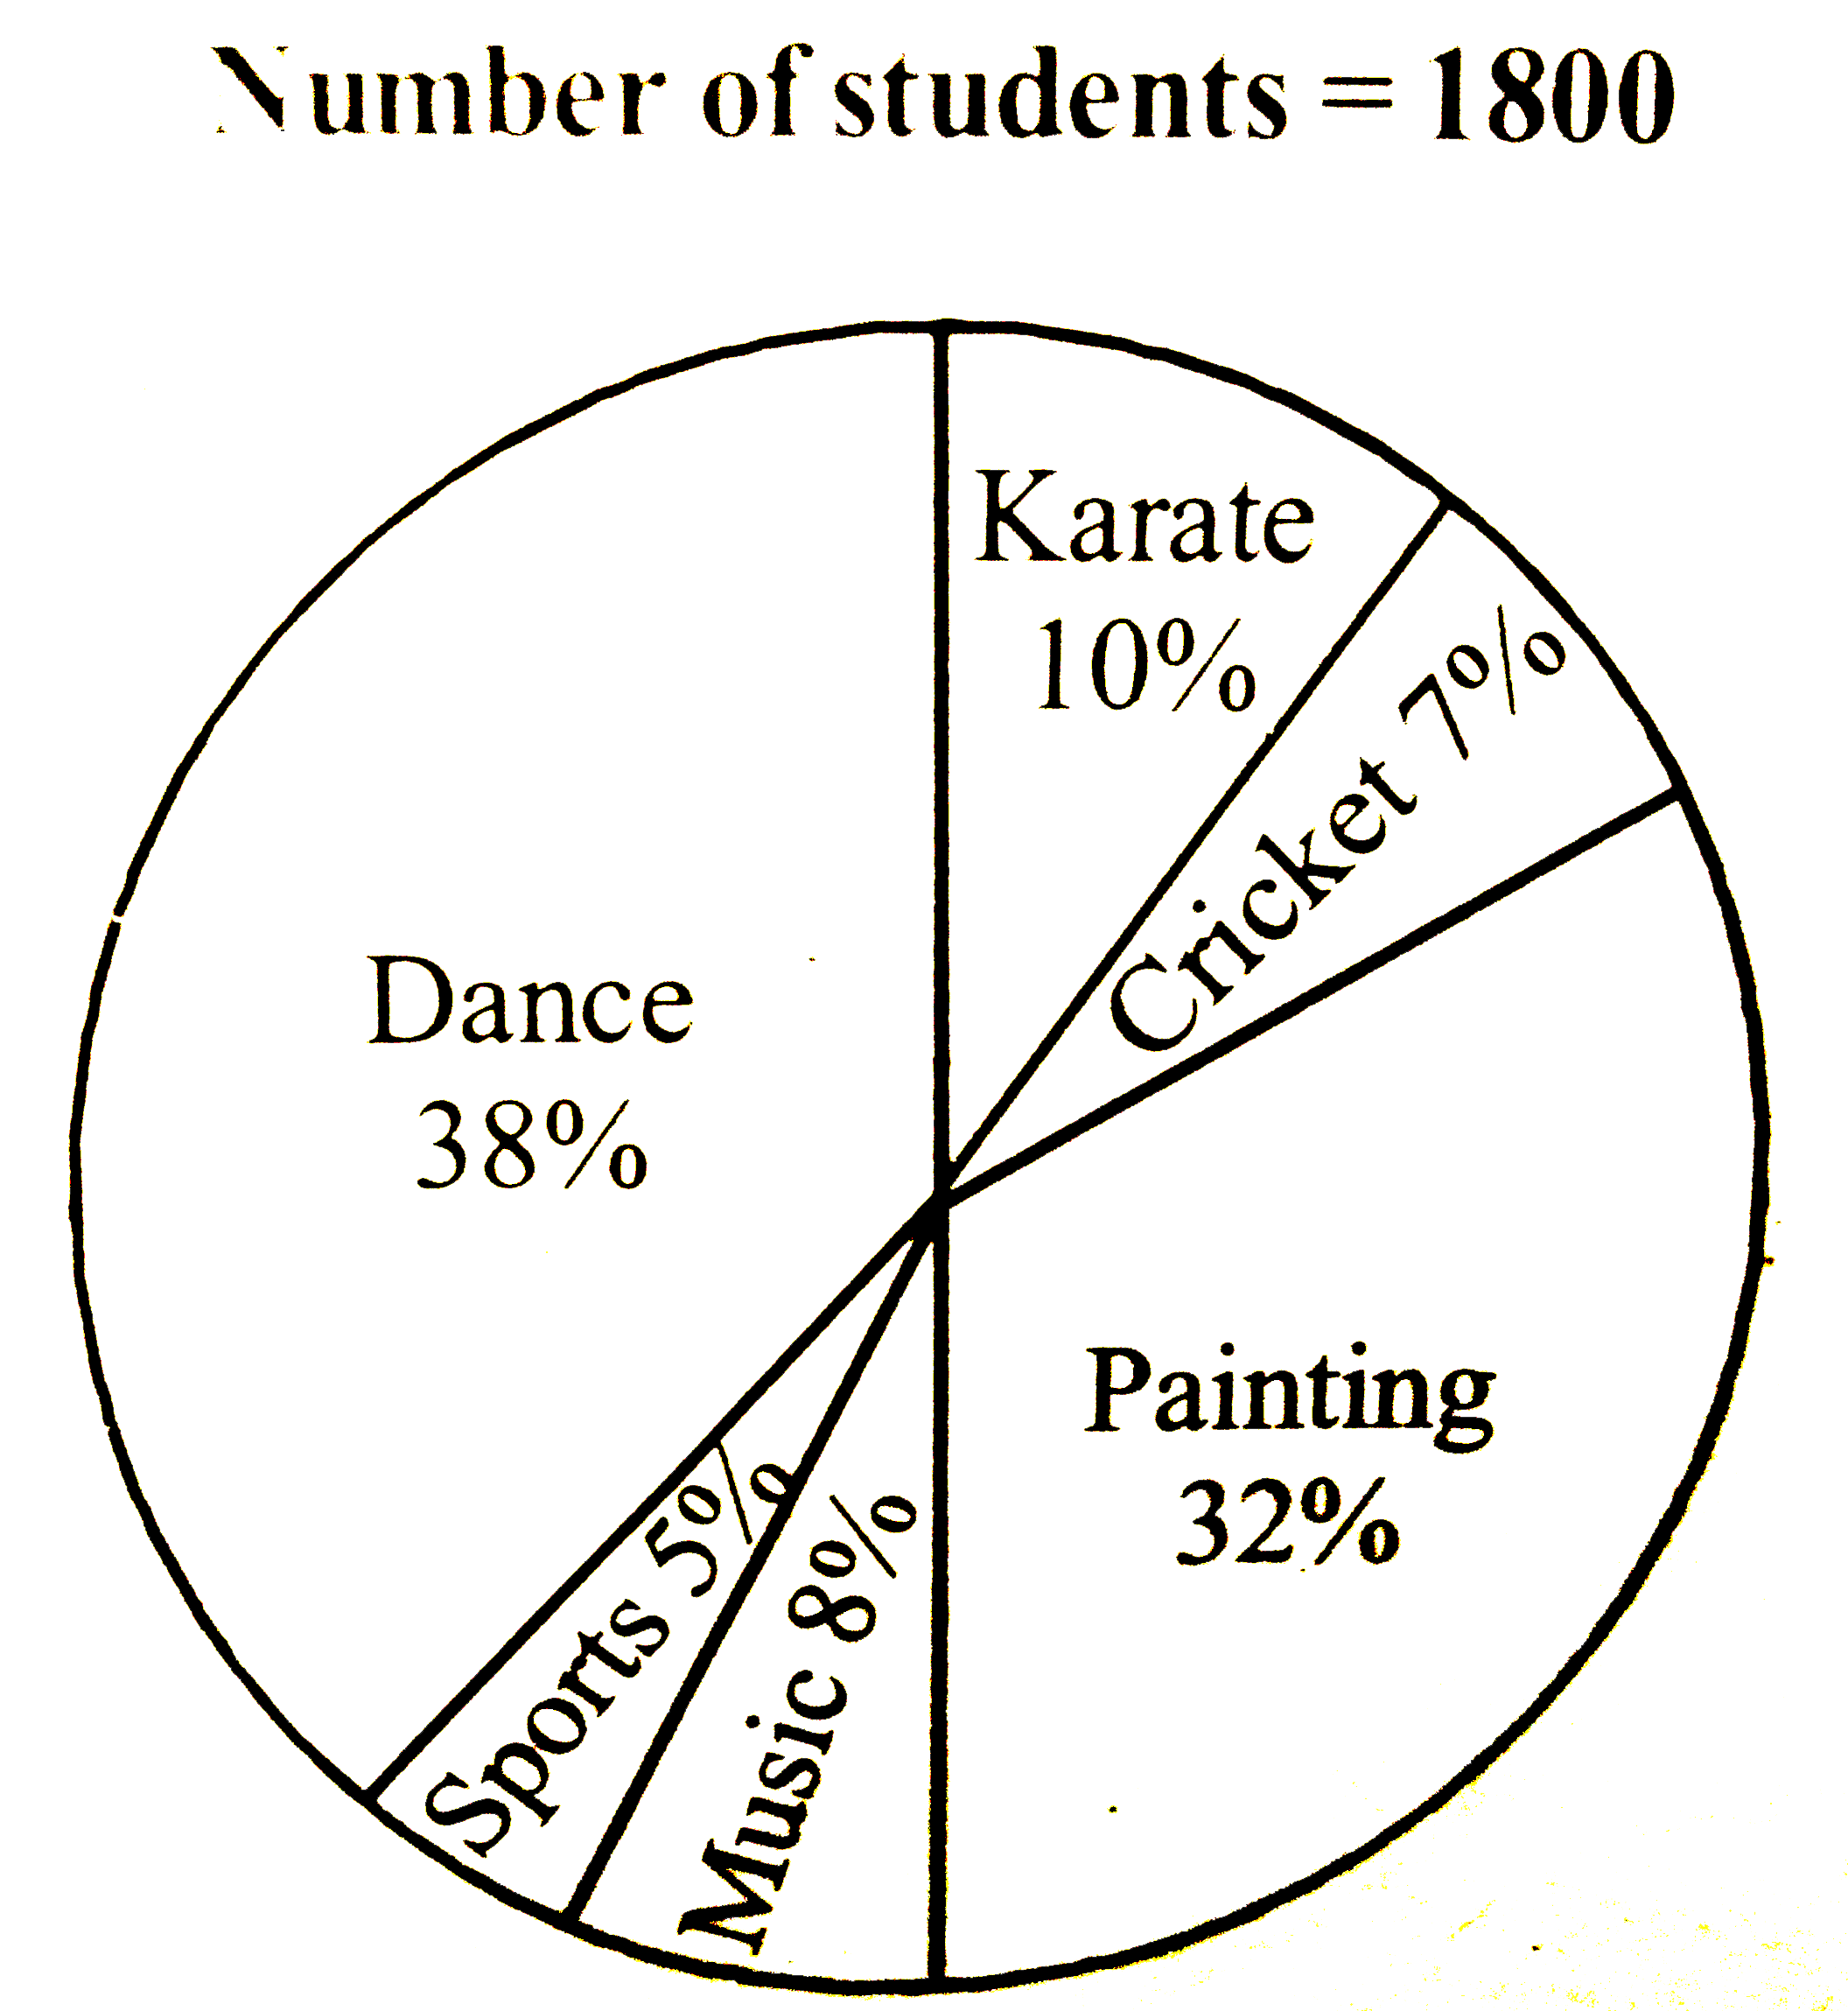
By What percent is the number of students who opted for cricket and dancing together more than those who opted for painting and music together ?
View Solution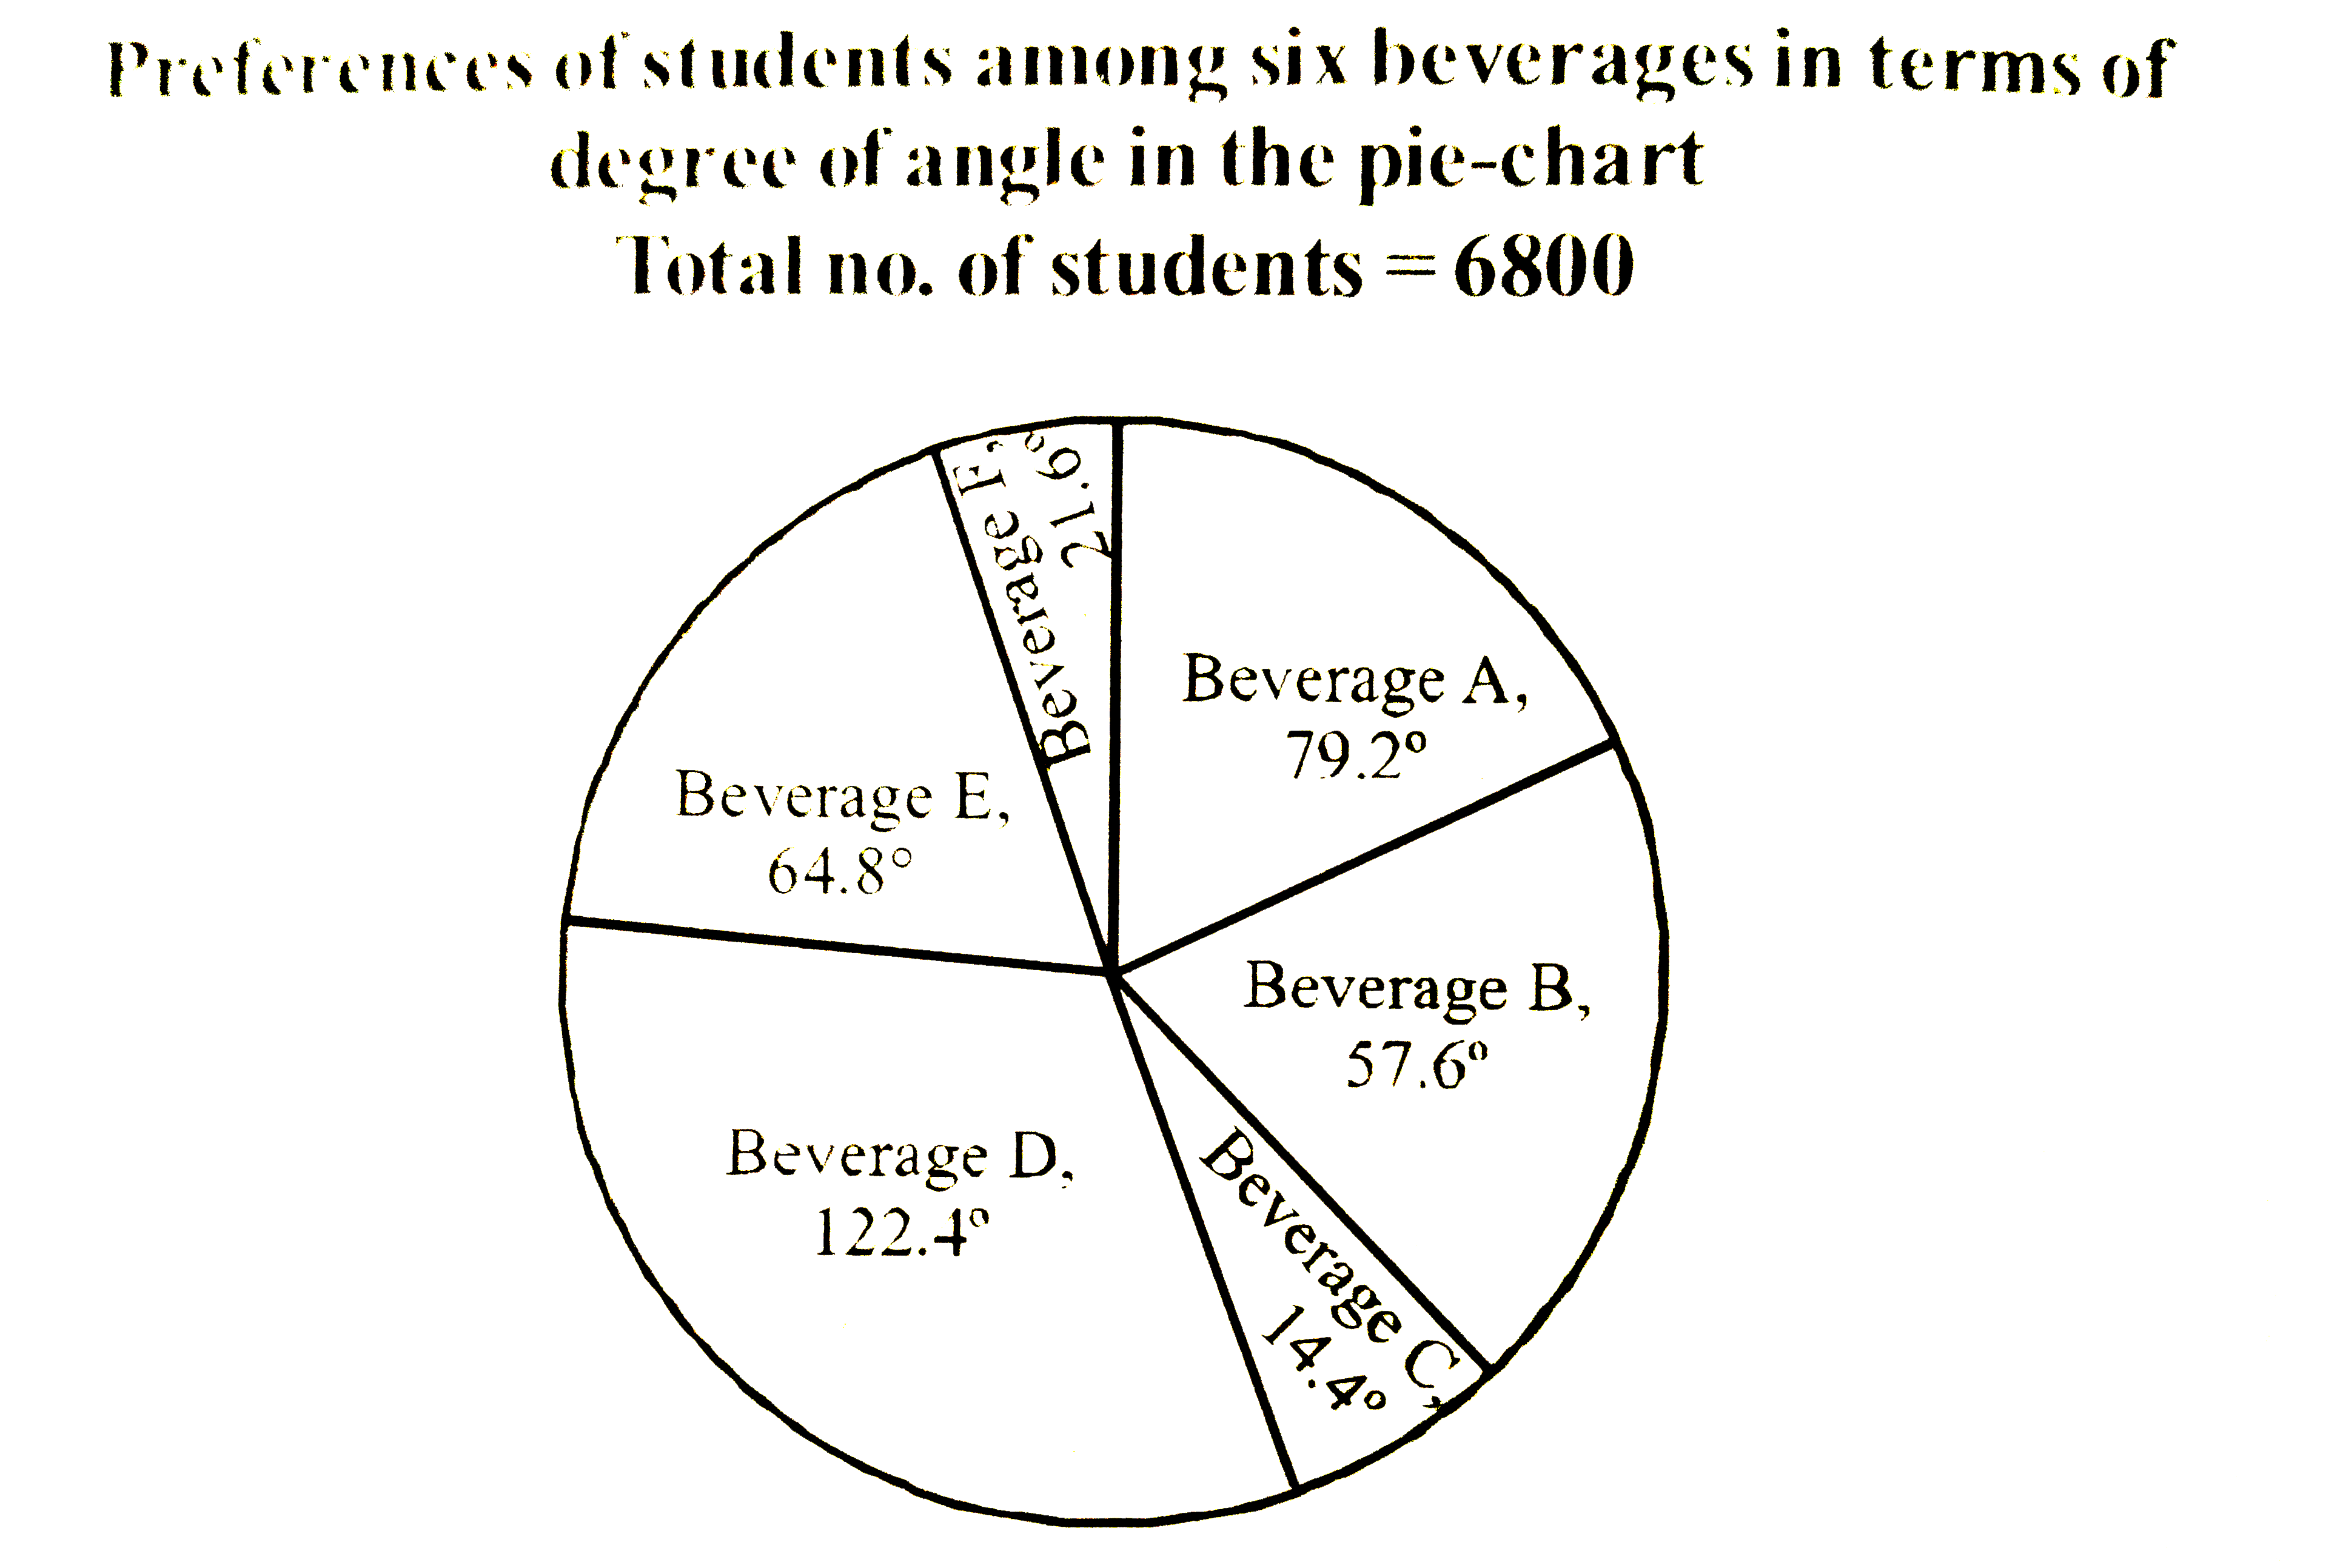
What is the differene between the total number of students who prefer Beverage A and C together and the total number of students who prefer Beverage D and F together ?
View Solution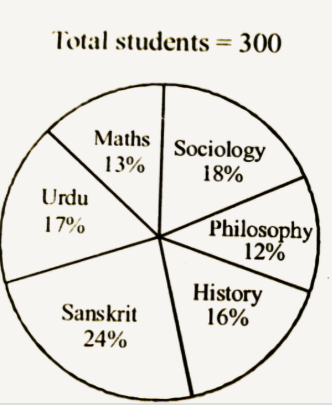
Find the ratio between total number of students who opted for Urdu, Histry and Sociogy together to total number of students who opted for Maths, Urdu and Sanskrit together ?
View SolutionDirections: Refer to the following graph and answer the given questions. Data related to the number of shoes sold by two stores (A and B )during five years:
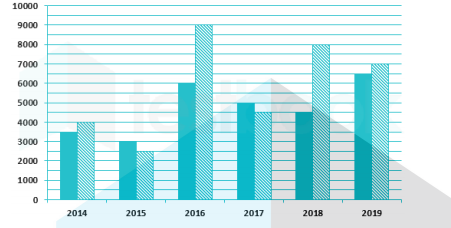
What is the difference between the total number of shoes sold by store A in 2018 and 2019 together and the total number of shoes sold by store B in 2014 and 2015 together?
View Solution
What is the total number of students passed from all institutes together in the year 2006
View Solution

