The bar chart shows the total number of members enrolled in different years from 1990 to 1994 in two gymnasiums A and B. Based on this bar chart, solve the following question:
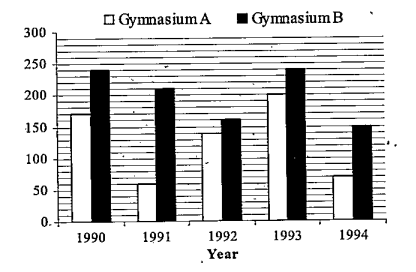
The total number of members enrolled in gymnasium B in 1993 and 1994 together is what per cent more than the number of members enrolled in gymnasium A in 1990 and 1994 together ? (Rounded off to two-digit decimal places )
60%
65%
62.5%
61.5%
The correct Answer is:C
Step by step video, text & image solution for The bar chart shows the total number of members enrolled in different years from 1990 to 1994 in two gymnasiums A and B. Based on this bar chart, solve the following question: The total number of members enrolled in gymnasium B in 1993 and 1994 together is what per cent more than the number of members enrolled in gymnasium A in 1990 and 1994 together ? (Rounded off to two-digit decimal places ) by Maths experts to help you in doubts & scoring excellent marks in Class 14 exams.
Updated on:21/07/2023Similar Questions
Knowledge Check
Study the graph carefully and answer the following questions.
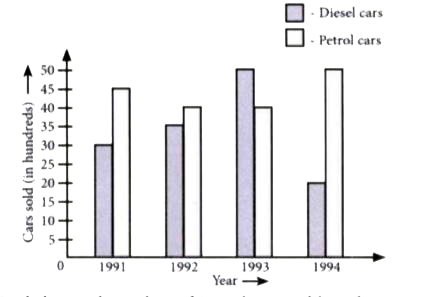
Find the total number of Diesel cars sold in the year 1992 and 1994 together.A2500B5500C1500D4500The given Bar Graph presents the number of students enrolled for a vocational course in institutes A and B during a period of five years.
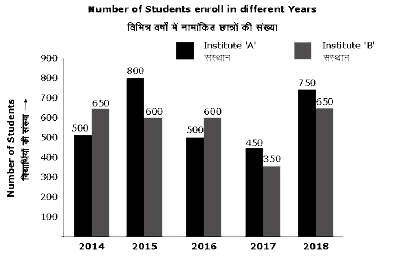
दिया गया दंड आरेख A और B संस्थानों में पांच वर्षों की अवधि के दौरान व्यावसायिक पाठ्यक्रमों नामांकन लेने वाले छात्रों की संख्या को दर्शाता है |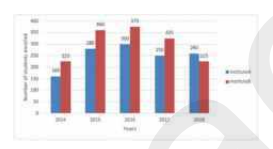 The total number of students enrolled in A during 2014, 2016 and 2018 is what percentage (correct to one decimal place) of the total number of students enrolled in B during the five years?
2014, 2016 और 2018 में A में नामांकन लेने वाले छात्रों की कुल संख्या इन पांच वर्षों के दौरान B में नामांकन लेने वाले छात्रों की कुल संख्या का कितना प्रतिशत ( एक दशमलव स्थान तक सही ) है ?A43.4B47.7C44.6D46.8The pie chart shows the number of students enrolled in the various engineering courses that a certain college offers. Studv the diagram and answer the following questions.
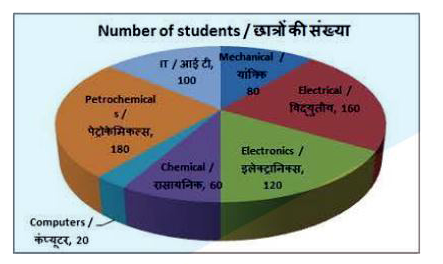
What is the total number of students enrolled in the college?Aa. 600Bb. 780Cc. 720Dd. 640
In the given bar graph, the number of students enrolled in institute b in the year 2016 is what percentage of students enrolled in institute A in 2016?
View SolutionThe pie-chart given below shows the number of students enrolled in a school in different activities. Total number of students in the school is 1200. Study the chart and answer the questions.
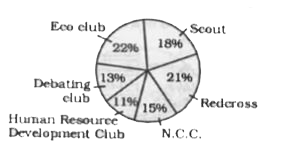
What is the total number of students enrolled in Debating Club and HRD Club ?
View Solution
In the given bar graph, the number of students enrolled in institute B in the year 2016 is what percentage of students enrolled in institute A in 2016?
View SolutionThe pie chart shows the number of students enrolled in the various engineering courses that a certain college offers. Study the diagram and answer the following questions.
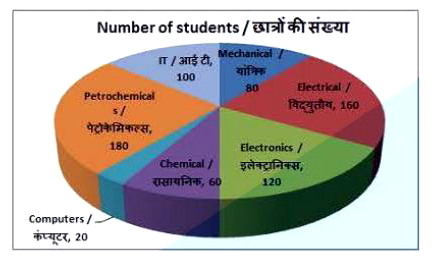
The most number of students are enrolled in which course?
View SolutionIn which year the number of students enrolled in B is x6more , where 25<x<30 then the number of students enrolled in A in the same year?
View Solution

