Study the given graph and answer the questopm the follows
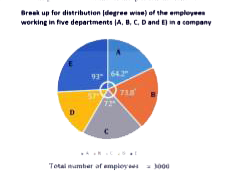
The number of employees in department B is what per cent of the total number of employees woking departments D and E ?
45.8
48.6
50.4
49.2
The correct Answer is:D
Step by step video, text & image solution for Study the given graph and answer the questopm the follows The number of employees in department B is what per cent of the total number of employees woking departments D and E ? by Maths experts to help you in doubts & scoring excellent marks in Class 14 exams.
Updated on:21/07/2023Topper's Solved these Questions
Similar Questions
Study the given graph and answer the question that follows:
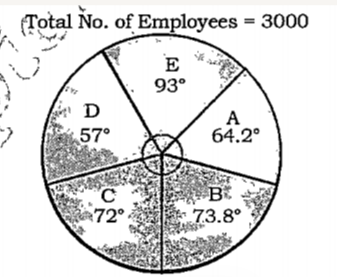
Breakup for distribution (degree wise) of the employees working in five departments (A,B,C,D, and E) in a company The number of employees in department B is what percent of the total number of employees working in department D and E?
दिए गए ग्राफ का अध्ययन करें और नीचे दिए गए प्रश्न का उत्त्तर दें। कंपनी के पांच विभागों (A, B, C, D और E) में काम कर रहे कर्मचारियों का वितरण
(डिग्री में) है। विभाग B में कर्मचारियों को संख्या, विभाग D और E में कार्य करने वाले कर्मचारियों की कुल संख्या की कितनी प्रतिशत है ?
View SolutionStudy the given graph and answer the question that follows.
दिए गए आरेख का अध्ययन करें और उन सवालों के जवाब दें जो अनुसरण करते हैं।
Break up for distribution ( degree wise) of the employees working in five departments (A, B, C, D and E) in a company
एक कंपनी के पाँच विभागों (A, B, C, D and E) में कार्य करने वाले कर्मचारियों का वितरण (डिग्री अनुसार):
The number of employees in department B is what percent of the total number of employees working in department D and E ?
विभाग B में कर्मचारियों की संख्या विभाग D और E में कार्यरत कर्मचारियों की कुल संख्या का कितना प्रतिशत है?
View Solution
Knowledge Check
Directions (Q. Nos. 1 - 5) Study the following graph and pie chart carefully and answer the Questions that follow.
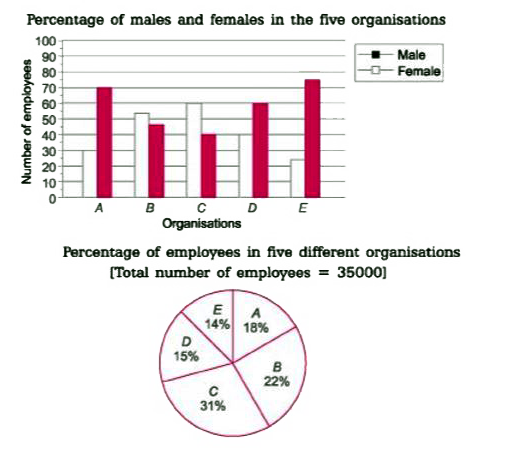
Total number of employees in organisation C is approximately what per cent of total number of employees in organisation D?A147%B279%C312%D207%Study the pie-chart and answer the question. Distribution (degree-wise) of the number of employees of a company working in 5 departments A, B, C, D and E.
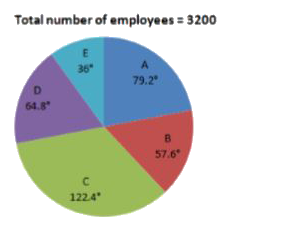
The number of employees working in department C is what percentage more than the total number of employees working in D and E? (Your answer should be correct to one decimal place.)A23.2B20.6C22.8D21.4The given pie chart shows the percentage distribution of 450 employees in an organisation. Read the pie chart and answer the question that follows.
Percentage of Employees in different Departments (Total 450 Employees )
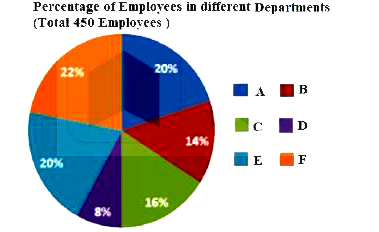
What is the number of employees working in department F?Aa)36Bb)99Cc)63Dd)72
Study the pie chart and answer the question
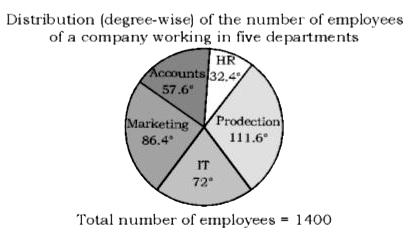
The total number of employees working in production and IT department exceeded the total number of employees working in the marketing and accounts department by
View SolutionStudy the pie chart and answer the question. Distribution of the number of employees of a companyworking in 5 department A, B , C, D and E
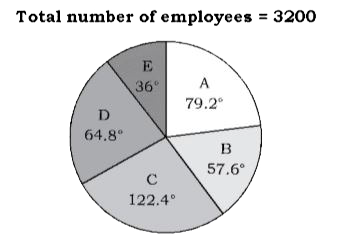
the number of employees working in department C is what percentage more than the total number of employees working in D and E?
View SolutionStudy the pie chart and answer the question
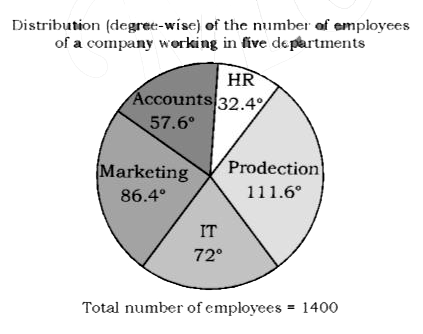
IF 80% of the number of employees working in IT department and 40% of the number of the employees working in both the HR and Accounts departments are females, then total number of female employees working in these three department is
View SolutionStudy the pie chart and answer the question
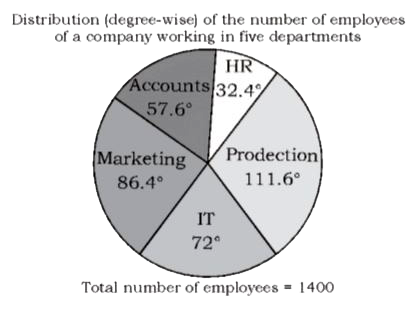
The number of employees of the company working in the Marketing department in what percentage more than the number of employees working in the IT department.
View Solution
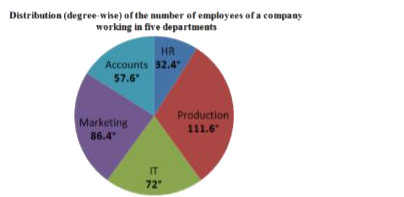
Study the pie-chart and answer the question: If 60% of the number of employees working in the IT department and 50% of the number of employees working in both the HR and Accounts departments are females, then total number of female employees working in these three departments is .........
View Solution
