The following line diagram represents the yearly sales figure of a company in the years 2001- 2010 . Examine the diagram and answer the question .
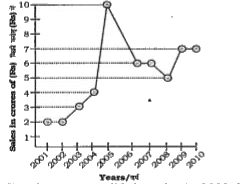
Average sale (in crore of Rs) of the company during the period 2003-2007 is
5.8
5
6
5.5
The correct Answer is:A
Step by step video, text & image solution for The following line diagram represents the yearly sales figure of a company in the years 2001- 2010 . Examine the diagram and answer the question . Average sale (in crore of Rs) of the company during the period 2003-2007 is by Maths experts to help you in doubts & scoring excellent marks in Class 14 exams.
Updated on:21/07/2023Topper's Solved these Questions
Similar Questions
The following line diagram represents the yearly sales figure of a company in the years 2001-2010. Examine the diagram and answer the question.
निम्नलिखित रेखा आरेख किसी कंपनी की वर्ष 2007-2010 के दौरान वार्षिक बिक्री के आंकड़ों को दर्शाता है। आरेख का अध्ययन करें और नीचे दिए गए प्रश्नों के उत्तर दें-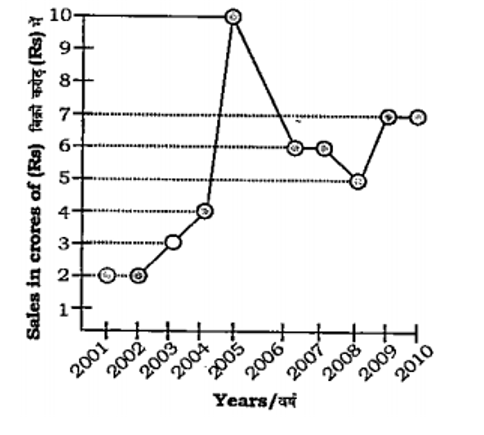 Average sale (in crore of Rs.) of the company during the period 2003-2007 is
वर्ष 2003 - 2007 की अवधि के दौरान कंपनी की औसत बिक्री (₹ करोड में) है-
View SolutionThe following line diagram represents the yearly sales figure of a company in the years 2001-2010. Examine the diagram and answer the question.
निम्नलिखित रेखा आरेख किसी कंपनी की वर्ष 2007-2010 के दौरान वार्षिक बिक्री के आंकड़ों को दर्शाता है। आरेख का अध्ययन करें और नीचे दिए गए प्रश्नों के उत्तर दें-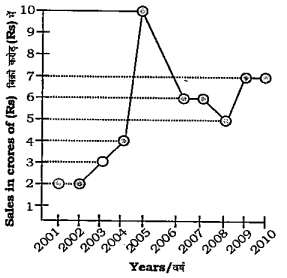 .............................................................................................................................................
Total sales (in crore of Rs.) from 2005 to 2008 is
वर्ष 2005 से वर्ष 2008 तक कुल बिक्री (रु. करोड में) है-
View Solution
Knowledge Check
The following bar diagram analys the sale of a company from 2000 to 2005, Examine the diagram and answer the questions.
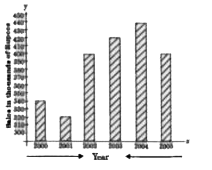
By what amount are the sales in 2003 more than those in 2001 ?ARs one thousandBRs ten thousandCRs one lakhDRs ten lakhsThe following bar diagram analys the sale of a company from 2000 to 2005, Examine the diagram and answer the questions.
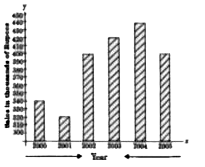
The sales in 2004 are what percentage of those in 2002?A40%B4%C110%D1.1%The following bar diagram analys the sale of a company from 2000 to 2005, Examine the diagram and answer the questions.
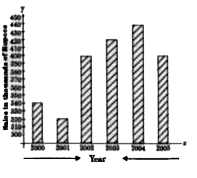
The sales in 2001 are how many times those of 2002 ?A8 timesB0.8 timesC2.5 timesD3 times
The following line diagram represents the yearly sales figure of a company in the years 2001-2010. Examine the diagram and answer the question.
निम्नलिखित रेखा आरेख किसी कंपनी की वर्ष 2007-2010 के दौरान वार्षिक बिक्री के आंकड़ों को दर्शाता है। आरेख का अध्ययन करें और नीचे दिए गए प्रश्नों के उत्तर दें-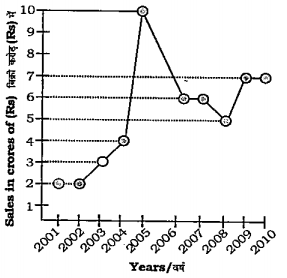 The ratio of sales in 2002 to that in 2007 is
वर्ष 2002 में बिक्री का वर्ष 2007 में बिक्री के साथ अनुपात है-
View SolutionThe following line diagram represents the yearly sales figure of a company in the years 2001-2010. Examine the diagram and answer the question.
निम्नलिखित रेखा आरेख किसी कंपनी की वर्ष 2007-2010 के दौरान वार्षिक बिक्री के आंकड़ों को दर्शाता है। आरेख का अध्ययन करें और नीचे दिए गए प्रश्नों के उत्तर दें-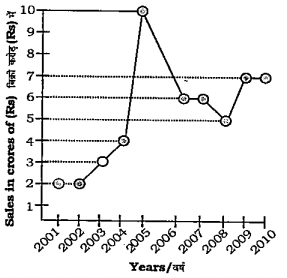 By what percent did the sales in 2008 decrease in comparison to the sales in 2006?
वर्ष 2006 में बिक्री की तुलना में वर्ष 2008 में बिक्रो में कितने प्रतिशत की कमी आई?
View SolutionThe following line diagram represents the yearly sales figure of a company in the years 2001-2010. Examine the diagram and answer the question.
निम्नलिखित रेखा आरेख किसी कंपनी की वर्ष 2007-2010 के दौरान वार्षिक बिक्री के आंकड़ों को दर्शाता है। आरेख का अध्ययन करें और नीचे दिए गए प्रश्नों के उत्तर दें- The percentage increase in sales in the year 2005 with respect to the previous year is
वर्ष 2005 में पिछले वर्ष की तुलना में बिक्री में वृद्धि का प्रतिशत है-
View SolutionThe following bar diagram analys the sale of a company from 2000 to 2005, Examine the diagram and answer the questions.
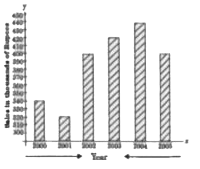
In which year did the sales show the least decrease to that of the preceding year ?
View SolutionThe following bar diagram analys the sale of a company from 2000 to 2005, Examine the diagram and answer the questions.
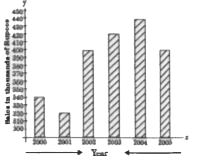
In which year did the sales show the least percent increase to that of the preceding year ?
View Solution
