In a village, the production of food grains increased by 40% and the per capita production of food grains increased by 27% during a certain period. The percentage by which the population of the village increased during the same period is nearest to
16
13
10
7
The correct Answer is:C
To solve the problem, we need to find the percentage increase in the population of the village given the increase in food grain production and per capita production.
1. Define Initial Values:
- Let the initial production of food grains be P=100 units.
- Let the initial population be N=100 people.
2. Calculate New Production:
- The production of food grains increased by 40%.
- Therefore, the new production P′ is:
P′=P+0.40×P=100+40=140 units
3. Calculate New Per Capita Production:
- The per capita production increased by 27%.
- The initial per capita production PC is:
PC=PN=100100=1 unit per person
- The new per capita production PC′ is:
PC′=PC+0.27×PC=1+0.27=1.27 units per person
4. Relate New Per Capita Production to New Population:
- The new population N′ can be calculated using the new production and new per capita production:
N′=P′PC′=1401.27
- Calculating N′:
N′≈110.24 people
5. Calculate the Increase in Population:
- The increase in population is:
Increase=N′−N=110.24−100=10.24 people
6. Calculate the Percentage Increase in Population:
- The percentage increase in population is given by:
Percentage Increase=(IncreaseN)×100=(10.24100)×100≈10.24%
7. Final Calculation:
- Since we need the nearest percentage, we can round it to:
Percentage Increase≈10%
Conclusion:
The percentage by which the population of the village increased during the same period is approximately 10%.
- Let the initial production of food grains be P=100 units.
- Let the initial population be N=100 people.
- The production of food grains increased by 40%.
- Therefore, the new production P′ is:
P′=P+0.40×P=100+40=140 units
- The per capita production increased by 27%.
- The initial per capita production PC is:
PC=PN=100100=1 unit per person
- The new per capita production PC′ is:
PC′=PC+0.27×PC=1+0.27=1.27 units per person
- The new population N′ can be calculated using the new production and new per capita production:
N′=P′PC′=1401.27
- Calculating N′:
N′≈110.24 people
- The increase in population is:
Increase=N′−N=110.24−100=10.24 people
- The percentage increase in population is given by:
Percentage Increase=(IncreaseN)×100=(10.24100)×100≈10.24%
- Since we need the nearest percentage, we can round it to:
Percentage Increase≈10%
The percentage by which the population of the village increased during the same period is approximately 10%.
Topper's Solved these Questions
- PERCENTAGEBOOK - GAGAN PRATAP CHAPTER - PERCENTAGEEXERCISE - Percentage (Sheet-2)
79 Videos
- PERCENTAGEBOOK - GAGAN PRATAP CHAPTER - PERCENTAGEEXERCISE - Percentage (Sheet-3)
38 Videos
- PARTNERSHIPBOOK - GAGAN PRATAP CHAPTER - PARTNERSHIPEXERCISE - Multiple Choice Questions
41 Videos
- PIPE & CISTERNBOOK - GAGAN PRATAP CHAPTER - PIPE & CISTERNEXERCISE - MULTIPLE CHOICE QUESTION
46 Videos
Similar Questions
The population of a village increases at a rate of 5% every year. If the present population of the village is 5620, find the population after 1 year.
View SolutionThe population of a village increases at a rate of 5% every year. If the present population of the village is 5620, find the population after 1 year.
View Solution
Knowledge Check
Green revolution resulted in the great increase in production of food grains due to:
Aintroduction of high-yielding varietiesBuse of pesticides to better management techniquesCuse of agrochemicalsDall of the above
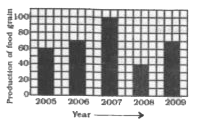
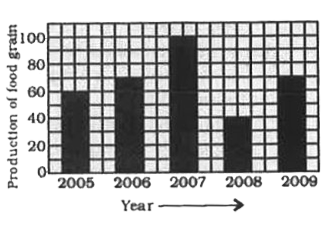
Study the bar graph showing the production of food grains (in million tons).
What is the ratio between the maximum production and the minimum production during the given period ?A1:2B2:3C3:4D5:2During the period between 1973 to 2003, the production has increased most in the
AMain sectorBPrimary sectorCTertiary sectorDNone of these
The present population of a city is 8000. If it increases by 10% during the first year and by 20% during the second year, then population after two years will be
View Solution
Study the above bar graph showing the production of food grains (in million tons). What is the ratio between the maximum production and the minimum production during the given period ?
View SolutionThe population of a village increases at a rate of 5% every year. If the present population of the village is 5620, find the population after 1 year.
View SolutionThe population of a village increases at a rate of 5% every year. If the present population of the village is 5620, find the population after 1 year.
View SolutionThe population of a city is 20000. It increases by 20% during the first year and 30% during the second year. The population af ter two years will be:
View Solution
