Study the following graph carefully and answer the question given below.
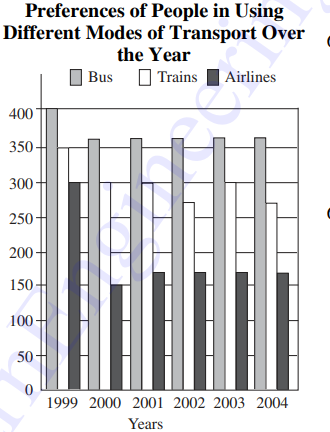
The number of people preferring to travel by train in 2004, was how many millions fewer than the number of people preferring to travel by train in 1999?
70
4
75
50
The correct Answer is:C
Step by step video, text & image solution for Study the following graph carefully and answer the question given below. The number of people preferring to travel by train in 2004, was how many millions fewer than the number of people preferring to travel by train in 1999? by Maths experts to help you in doubts & scoring excellent marks in Class 14 exams.
Updated on:21/07/2023Topper's Solved these Questions
Similar Questions
Knowledge Check
Study the following graph carefully and answer the question given below.
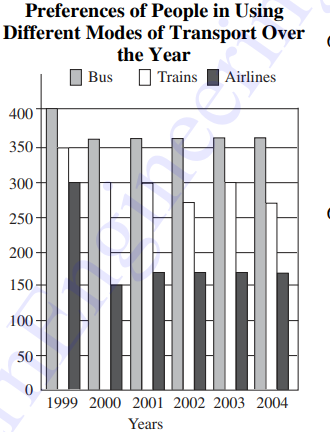
What is the respective the number of people preferring to travel by bus to the number of people preferring to travel by train in the year 2002?A15:11B9:7C7:9D11:15Study the following graph carefully and answer the question given below.
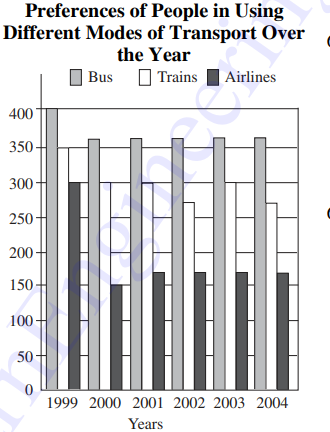 From 1999 to 2004, the total number of people who preferred to travel by trains, was approximately how many millions? A1300B1800C1600D1700
Study the following graph carefully and answer the question given below.
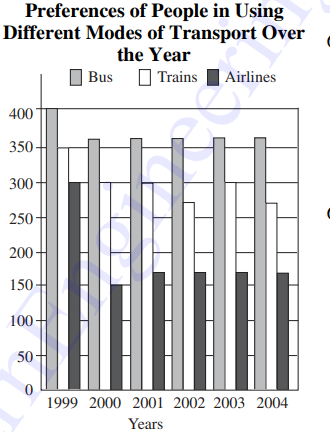 In 2001, the people preferring to travel by bus represented approximately what percent of the people preferring to travel by buses, trains and airlines together in that year? A65%B25%C55%D45%
Direction :- Study of bar graph and answer the questions.
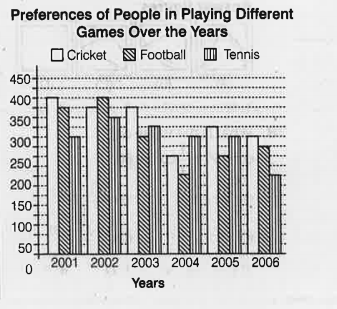
The number of people prefering to play Tennis in 2006, is how many millions fewer than the number of people prefering to play Tennis in 2005?
(A) 115 (B) 120 (C) 100 (D) 97
View SolutionStudy the following graph carefully and answer the questions that
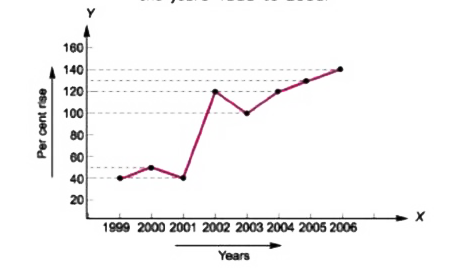
For how many years , the percent rise was more than 100 % ?
View SolutionStudy the following graph carefully and answer the questions given below
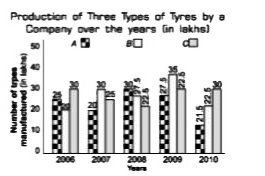
The total number of all the three types of tyres manufactured was the least in which of the following years?
View SolutionStudy the following graph carefully and answer the questions given below it :-
Number of people working in various departments of two different organisation:
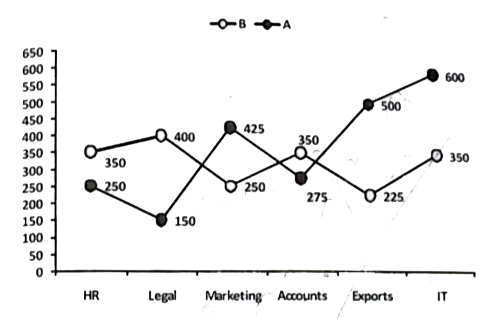
What is the total number of people working in organisation B?
View SolutionStudy the following graph carefully to answer the questions given below.
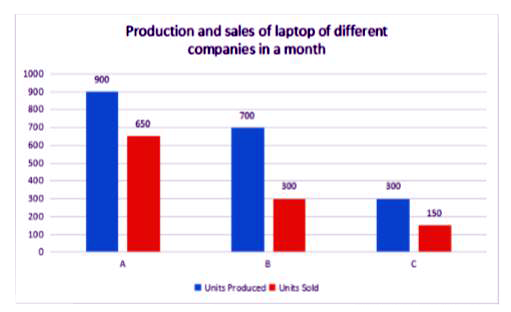
What is the average number of Units produced by all the Companies together?
View Solution

