The following questions depends on the table given below-
Distribution of malnutrition in children in percentage in various
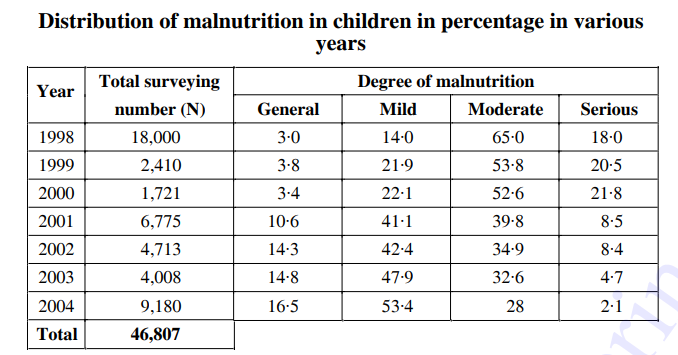
How many were normal in the number of the surveying in all the years?
A
4439
B
7723
C
2681
D
4192
Text Solution
The correct Answer is:D
|
Updated on:21/07/2023
Related Playlists
Knowledge Check
- Question 1 - Select One
The following questions depends on the table given below-
Distribution of malnutrition in children in percentage in various
How many percent approximately was mild malnutrition in all the years together?A30B32C42D46 - Question 1 - Select One
The following questions depends on the table given below-
Distribution of malnutrition in children in percentage in various
How many cases were moderate and serious malnutrition together in the surveying in 1998?A15000B11700C14220DNone of these - Question 1 - Select One
The following questions depends on the table given below-
Distribution of malnutrition in children in percentage in various

In which of the following years there was most improvement in degree of malnutrition in comparison of previous year?A2000B2001C2002D2003 - Question 1 - Select One
The following questions depends on the table given below-
Distribution of malnutrition in children in percentage in various
What was the approximate percentage decrease in moderate cases from 1998 to 2004?A57B37C43D1123 - Question 1 - Select One
Study the following pie-chart carefully and answer the questions given below :-
Survey conducted on 12000 people of various professionals and percentage of female professionals
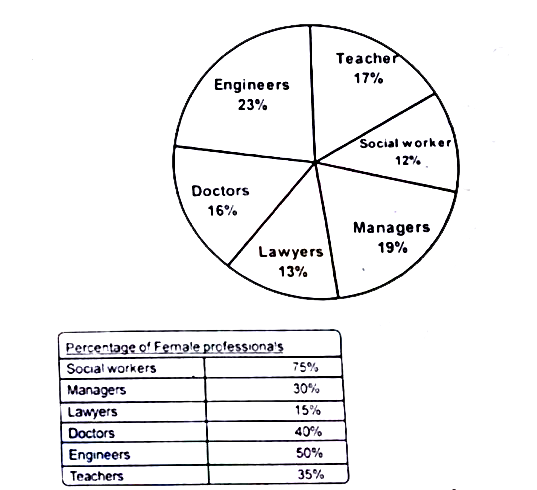
The total number of engineers is approximate what percent of the total number of Lawyers in the town ?A165%B138%C154%D177% - Question 1 - Select One
The pie chart describes the characteristics of India visiting UK from various states during given year. Answer the following question given below : Assume that the age wise distribution data applies to all states and that in the given year, 1,00,000 Indian visited UK:
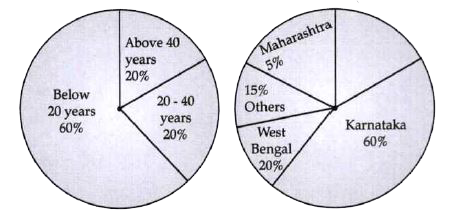
How many visitors were below 20 years of age but were neither from Karnataka, nor Maharashtra or West Bengal ?A7000B15000C9000D6000 - Question 1 - Select One
Study the following graph carefully and answer the question given below
Number of candidates appeared (in thousand) and percentage of candidates qualified in a competitive examination over the years.
No. of candidates appeared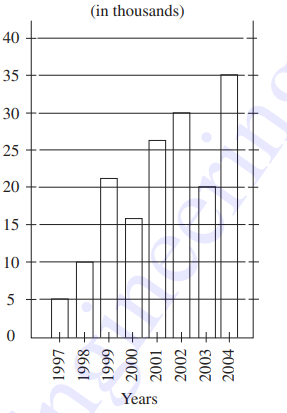
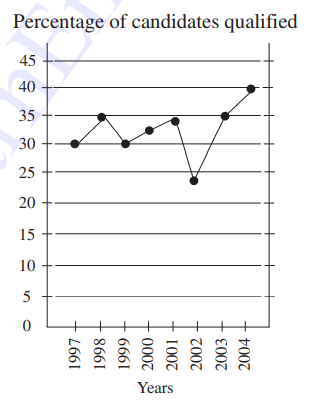
How many candidates qualified in the year 2002?A7200B13500C9900DCannot be determined - Question 1 - Select One
Number of different colleges in India in different years is given in the graph below. Distribution of different colleges in the years 1980 and 1990 shown in the pie charts below :
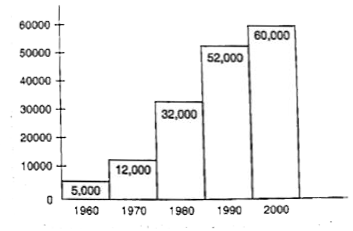
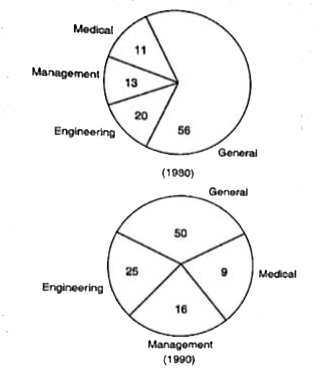
What is percentage increase in the number of colleges from 1960 to 1990 ?A10B9.4C10.4D4.7
Similar Questions
The following table given the percentage distribution of female students in various schools of rural areas of various State(s) and Union Territories (UT) of India who get scholarship.

Find the mean percentage of femal students getting scholarship.View SolutionRead the following table carefully and answer the questions given below:
Number of questions asked in different subjects during different years in an examination of Bank.

What was the percentage decrease in the number of questions asked from General Studies from year 2005 to 2006 ?View Solution

