The following graph shows the temperature of a patient observed in a hospital at a certain interval of time on a certain day. Starting at 5 A.M.
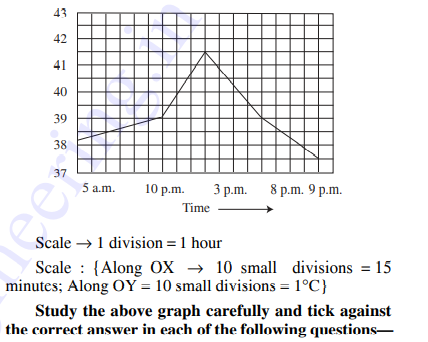
At what time during the day, the temperature was maximum ?
12 P.M.
12.30 P.M.
1 P.M.
1.30 P.M.
The correct Answer is:C
Step by step video, text & image solution for The following graph shows the temperature of a patient observed in a hospital at a certain interval of time on a certain day. Starting at 5 A.M. At what time during the day, the temperature was maximum ? by Maths experts to help you in doubts & scoring excellent marks in Class 14 exams.
Updated on:21/07/2023Topper's Solved these Questions
Similar Questions
The following graph shows the temperature of a patient in a hospital , recorded every hour.
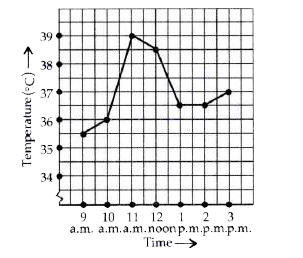
(a) What was the patient's temperature at 1 p.m. ?
(b) When was the patient's temperature 38.5∘C ?
(c ) The patient's temperature was the same two times during the period given. What were these two times?
(d) What was the temperature at 1.30 p.m.? How did you arrive at your answer?
(e) During which periods did the patient's temperature showed an upward trend?
View SolutionThe following graph show the temprature of a patient in a hospital, recorded every hour, (a) What was the patient's temperature at 1 p.m.? *b) When was the patient's temperature 38.5∘C ? (j) The patient’s temperature was the same two times during the period given. What were these two times? (k) What was the temperature at 1.30 p.m.? How did you arrive at your answer? (l) During which periods did the patients’ temperature showed an upward trend?
View Solution
Knowledge Check
The following graph shows the temperature of a patient observed in a hospital at a certain interval of time on a certain day. Starting at 5 A.M.
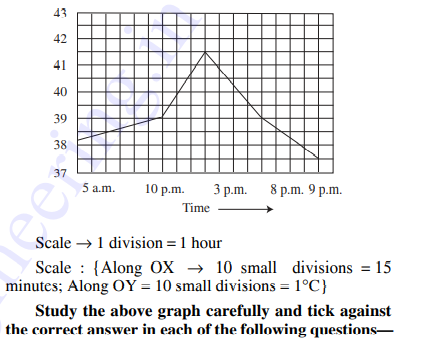
What was the maximum temperature during the day ?A40.7∘CB41.5∘CC40.8∘CD41∘CThe following graph shows the temperature of a patient observed in a hospital at a certain interval of time on a certain day. Starting at 5 A.M.
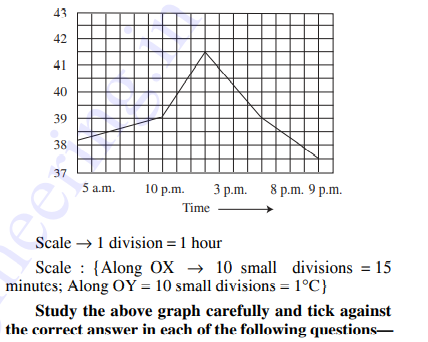
What was the temperature of the patient at 2 p.m.?A40.8∘CB41.1∘CC41.5∘CD41.9∘CThe following graph shows the temperature of a patient observed in a hospital at a certain interval of time on a certain day. Starting at 5 A.M.
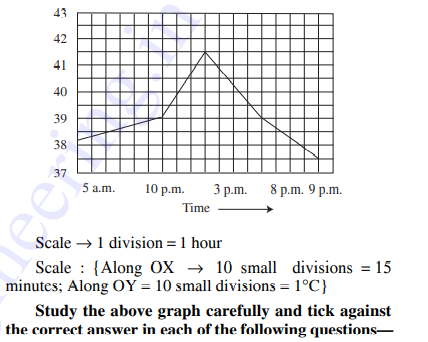
The time, when the temperature was recorded 40∘C was -----A11 A.M.B10.30 A.M.C11.45 A.M.D11.15 A.M.
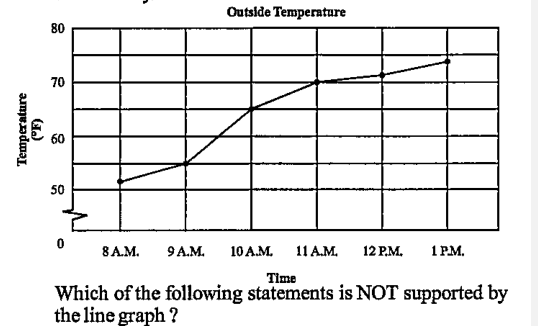
The graph below shows the outside temperature at various times of day.
View SolutionThe following graph shows the temperature forecast and the actual temperature for each day of a week.(a) On which days was the forecast temperature the same as the actual temperature? (b) What was the maximum forecast temperature during the week?(c) What was the minimum actual temperature during the week?(d) On which day did the actual temperature differ the most from the forecast temperature?
View SolutionThe following graph shows the temperature of a patient observed in a hospital at a certain interval of time on a certain day. Starting at 5 A.M.
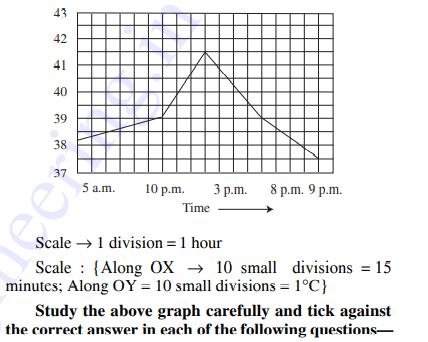
The normal temperature is 37.5∘C . At what time was the temperature normal ?
View SolutionDay time temperature of moon is
View SolutionDay time temperature of moon is
View Solution
