The ratio of the prices of three different types of cars is 4:5:7. If the difference between the costliest and the cheapest cars is Rs. 60000 the price of the car of modest price of -
Rs. 80,000
Rs. 1,00,000
Rs. 1,40,000
Rs. 1,20,000
The correct Answer is:B
Step by step video, text & image solution for The ratio of the prices of three different types of cars is 4:5:7. If the difference between the costliest and the cheapest cars is Rs. 60000 the price of the car of modest price of - by Maths experts to help you in doubts & scoring excellent marks in Class 14 exams.
Updated on:21/07/2023Topper's Solved these Questions
Similar Questions
The marked price of an article is 150% more than the cost price and the discount given on the marked price is 30%. If the difference between selling price and cost price is Rs.525, find the cost price of the article.
View SolutionIf SP>CP, then the difference between the selling price and the cost price is ____________.
View Solution
Knowledge Check
The difference between the cost price and sale price is ₹ 240. If the profit is 20%, the selling price is :
A₹1200B₹1440C₹1800D₹2440The difference between the selling prices of an article sold at 4% and 3% profits is Rs. 3. The cost price of the article is:
A1. 400B2. 350C3. 300D4. 100The difference between the selling prices of an item at a profit of 9% and 7% was Rs 190. Find the cost price of the item.
ARs, 9,200BRs 9,500CRs 8,700DRs 9,000
The ratio between the sale price and the cost price of an article is 7:5. What ratio between the profit and the cost price of that article ?
View SolutionIf the ratio between the profit and selling price of an article is 1:5, then the ratio between the selling price and the cost price of that article is:
View SolutionThe ratio of the cost price and the selling price is 7:5. The profit percent is -
View SolutionThe difference between cost price and selling price is Rs 12.54. If loss percentage is 33%, then what is the cost price (in Rs)?
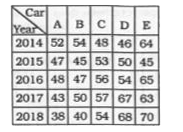
View SolutionThe table shows the production of different types of cars by a company (in thousands) in 5 years. Study the table and answer the questions.

What is the ratio of the total production of type C cars in 2015 and type D cars in 2017 taken together to the total production of type B cars in 2016 and type A cars in 2017 taken together ?
View Solution
