Study the following table and answer the given questions. Number of perfume bottles sold by 5 stores during 5 months
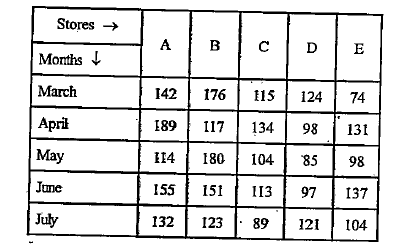
What is the average number of perfume bottles sold by store C in April June and July?
114
108
112
106
The correct Answer is:C
Step by step video, text & image solution for Study the following table and answer the given questions. Number of perfume bottles sold by 5 stores during 5 months What is the average number of perfume bottles sold by store C in April June and July? by Maths experts to help you in doubts & scoring excellent marks in Class 14 exams.
Updated on:21/07/2023Similar Questions
Directions: Refer to the following graph and answer the given questions. Data related to the number of shoes sold by two stores (A and B )during five years:
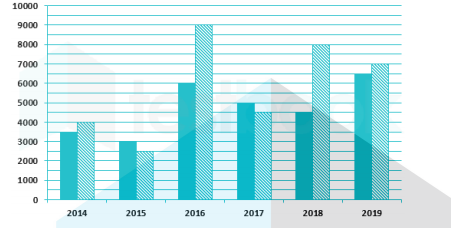
Find the ratio between the total number of shoes sold by stores A and B together in 2016 to the total number of shoes sold by stores A and B together in 2018?
View Solution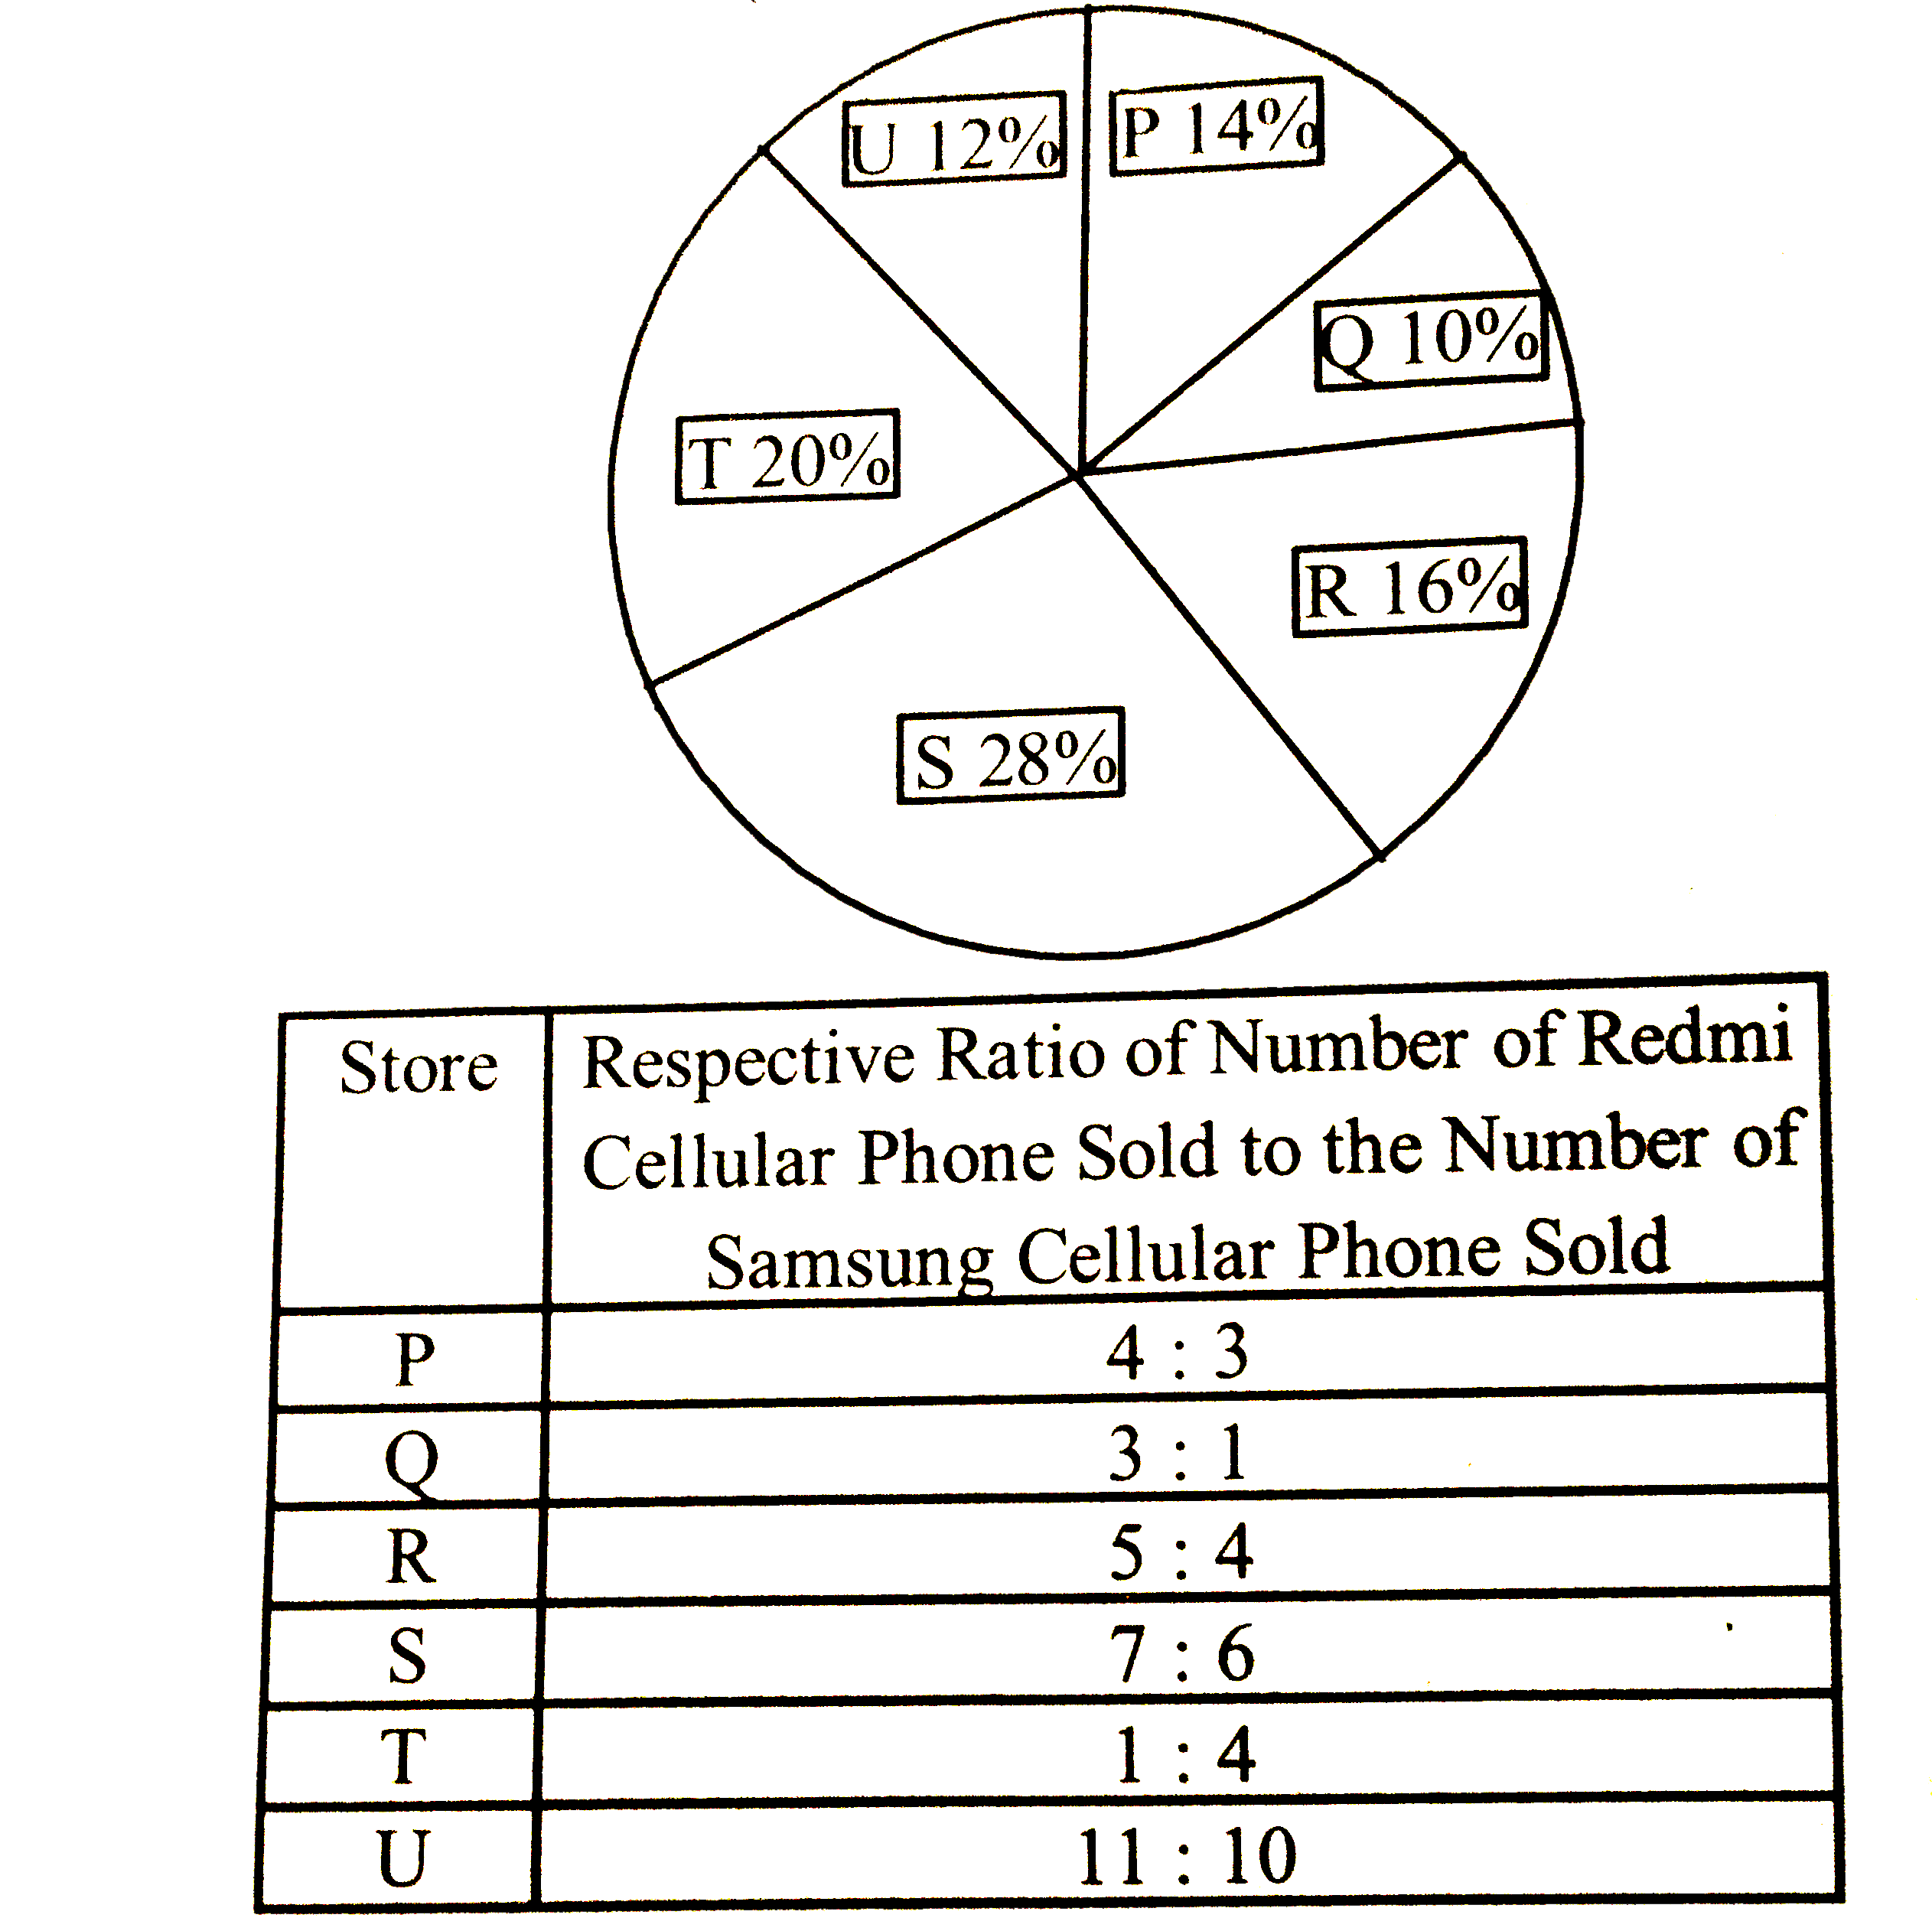
What is the average number of Redmi cellular phones sold bo stores P, R, S and T together ?
View Solution
Knowledge Check
The table shows the number of cars sold by three showrooms over a period of six years.
यह तालिका तीन शोरूम द्वारा छः वर्षों की अवधि में बेची गयी कारों की संख्या दर्शाती है |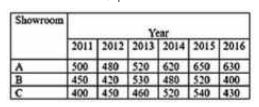 What is the average number of cars sold by showroom A over the given six years (nearest to one decimal place)?
दिए गए छः वर्षों में शोरूम A द्वारा बेची गयी कारों की औसत संख्या कितनी है ? (एक दशमलव स्थान के निकटतम )A586.7B566.7C594.7D592.7Study the following bar-diagram and answer the questions.
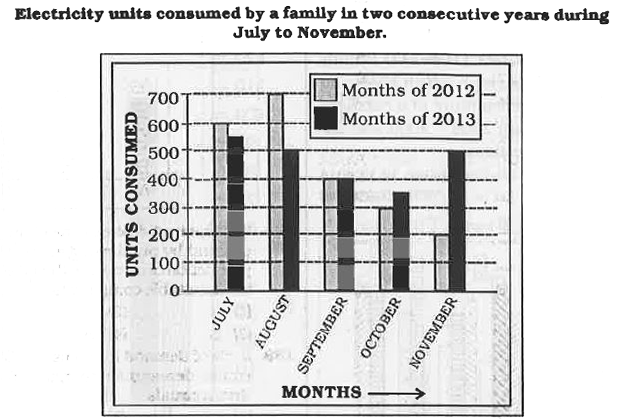
The average electric consumption by the family during these 5 months in 2013 isA460 unitsB400 unitsC440 unitsD450 unitsWhat was the average number of cars sold by A during Feb-Apr 2016
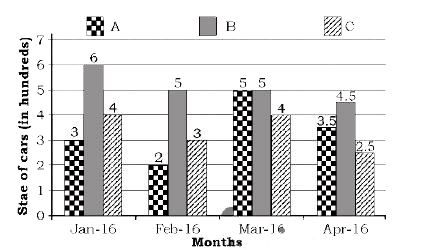 A375B350C250D300
Direction: The given bar graph shows the number of pens sold by two shops A & B in four consecutive months. Study the following data and answer the following questions:
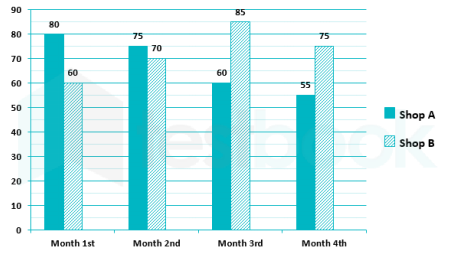
Find the ratio of the number of pens sold by shop A in months 1st and 3rd together to the number of pens sold by shop B in months 2nd and 4th together.
View SolutionDirection: The given bar graph shows the number of pens sold by two shops A & B in four consecutive months. Study the following data and answer the following questions:
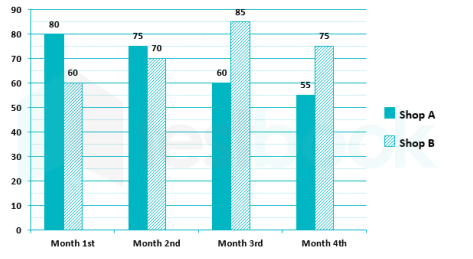
Find that the number of pens sold by shop A in 1st month is how much percent more than the number of pens sold by shop A in 3rd month.
View SolutionDirections: Refer to the following graph and answer the given questions. Data related to the number of shoes sold by two stores (A and B )during five years:
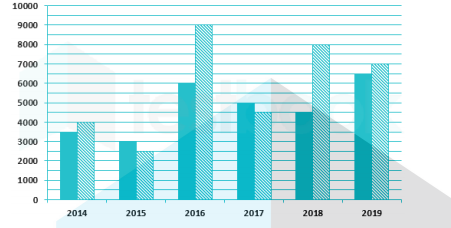
The number of shoes sold by store A decreased by what percent from 2017 to 2018?
View SolutionDirections: Refer to the following graph and answer the given questions. Data related to the number of shoes sold by two stores (A and B )during five years:
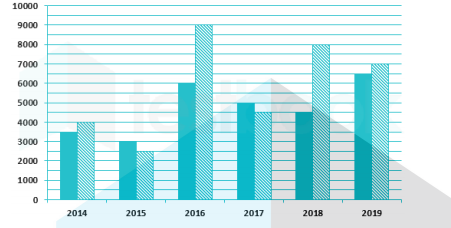
What is the difference between the total number of shoes sold by store A in 2018 and 2019 together and the total number of shoes sold by store B in 2014 and 2015 together?
View SolutionDirection: The given bar graph shows the number of pens sold by two shops A & B in four consecutive months. Study the following data and answer the following questions:
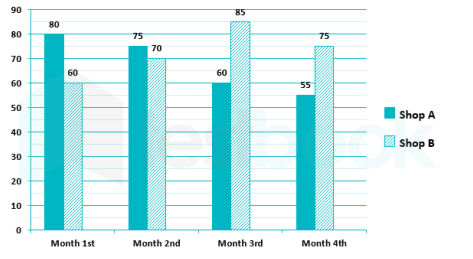
Find the average of the number of pens sold by shop A in 1st and 3rd months and the number of pens sold by shop B in 3rd and 4th month together.
View Solution
