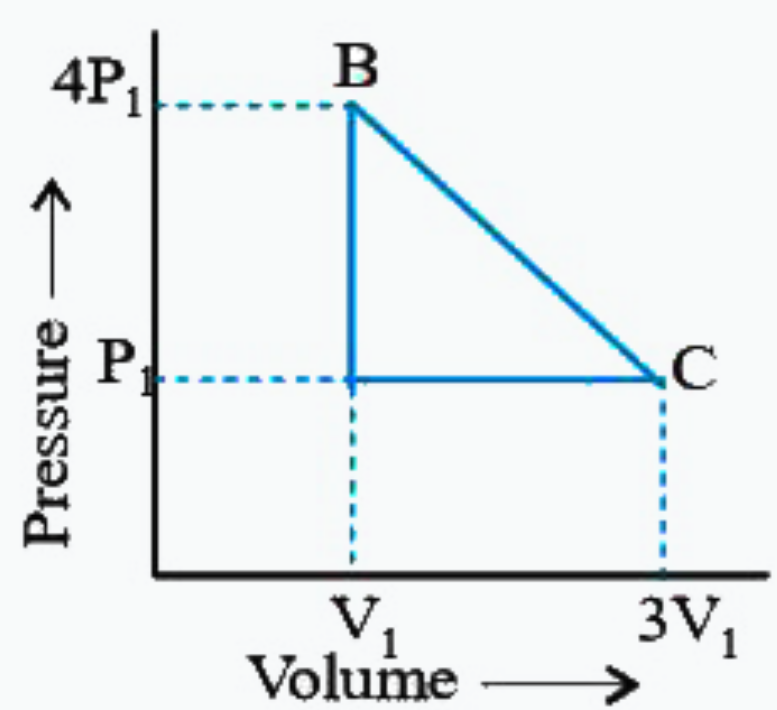
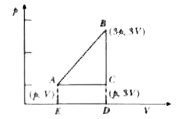
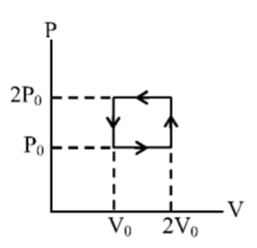
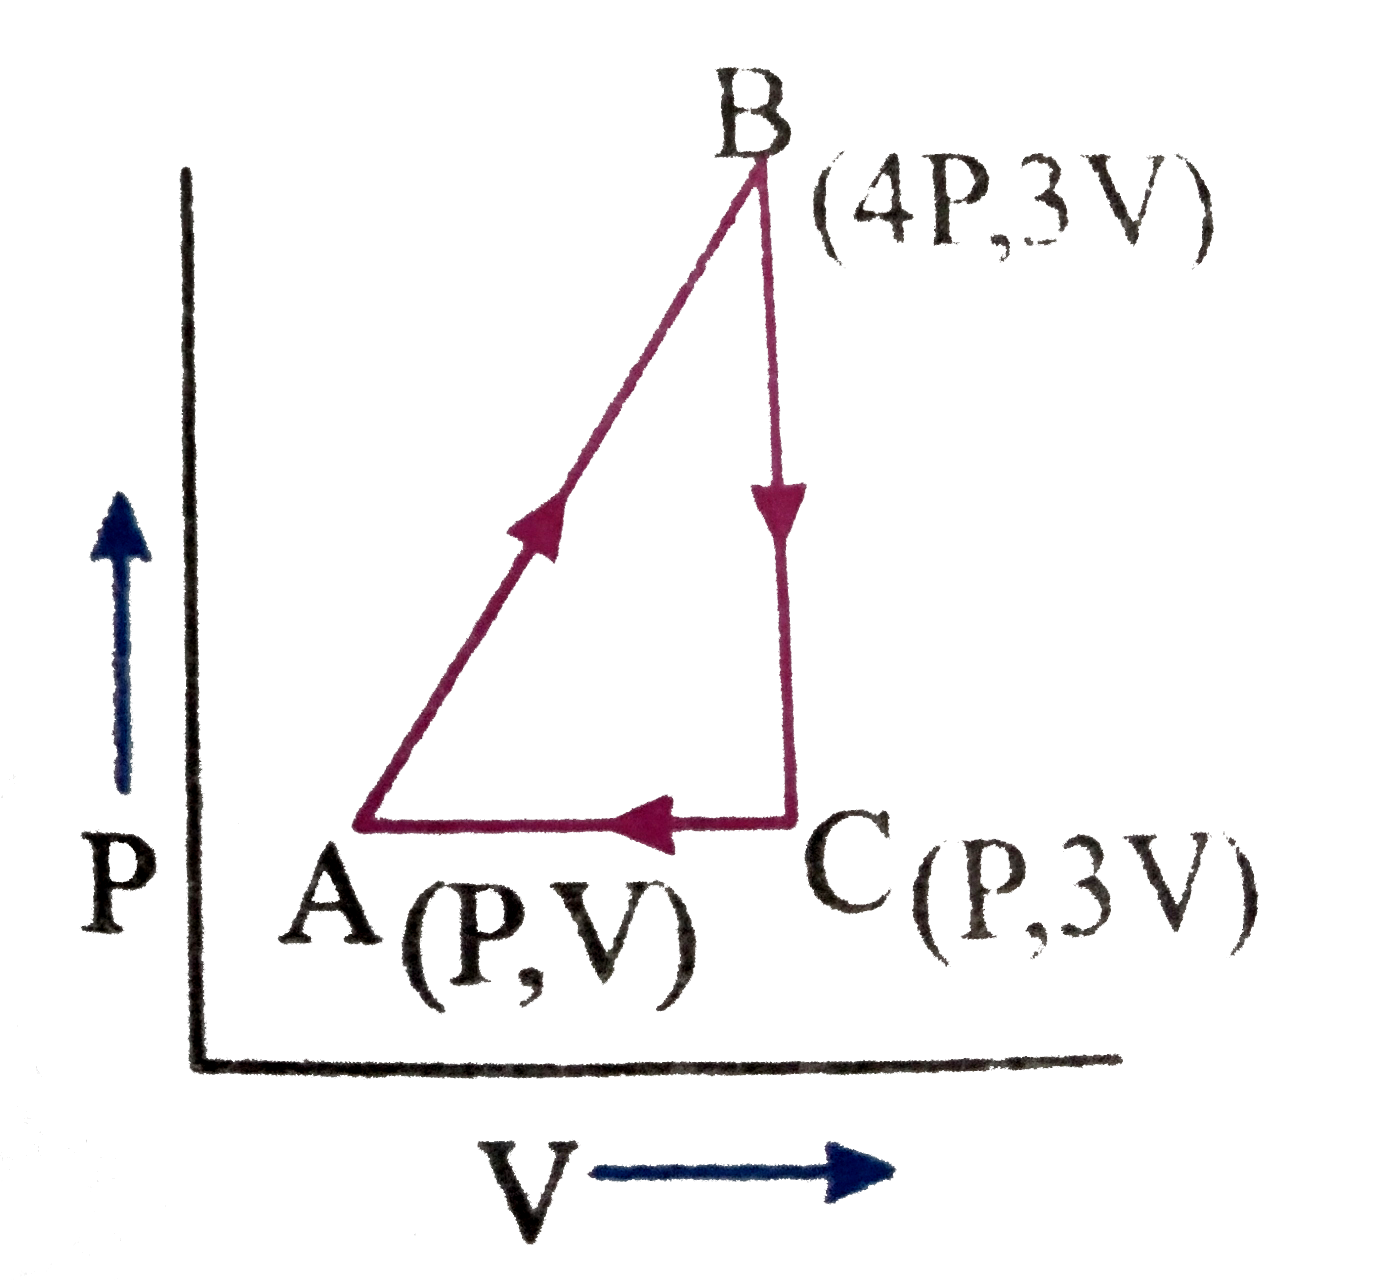
In the figure shown below, an ideal gas is carried around the cyclic process. How much work is done in one cycle if litre?
A
5656 J
B
C
10600 J
D
11300 J
Video Solution
Text Solution
The correct Answer is:B
Work done is area under the curve
|
Topper's Solved these Questions
Similar Questions
Knowledge Check
In the cyclic process shown in the figure, the work done by the gas in one cycle is
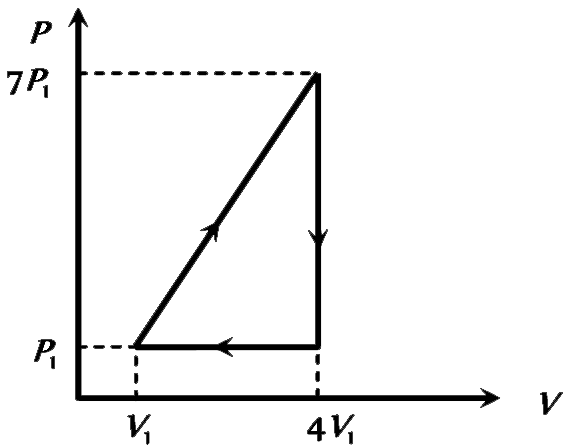 A28P1V1B14P1V1C18P1V1D9P1V1
In figure, P−V curve of an ideal gas is given. During the process, the cumulative work done by the gas
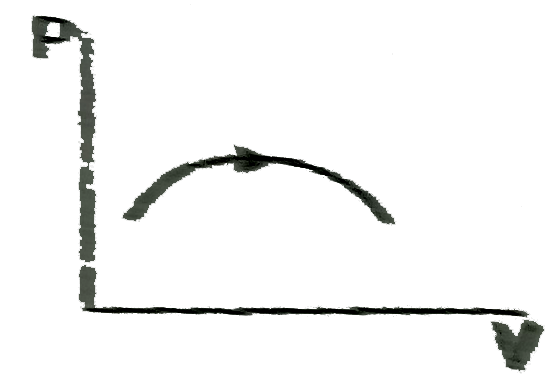 Acontinuously increasesBcontinuously decreasesCfirst increases then decreasesDfirst decreases then increases
An ideal gas is taken around the cycle ABCD A as shown in figure . The net work done during the cycle
is equal to :
 AzeroBpositiveCnegativeDwe cannot predict
P – V graph for a cyclic process is shown in figure . Work done is given by
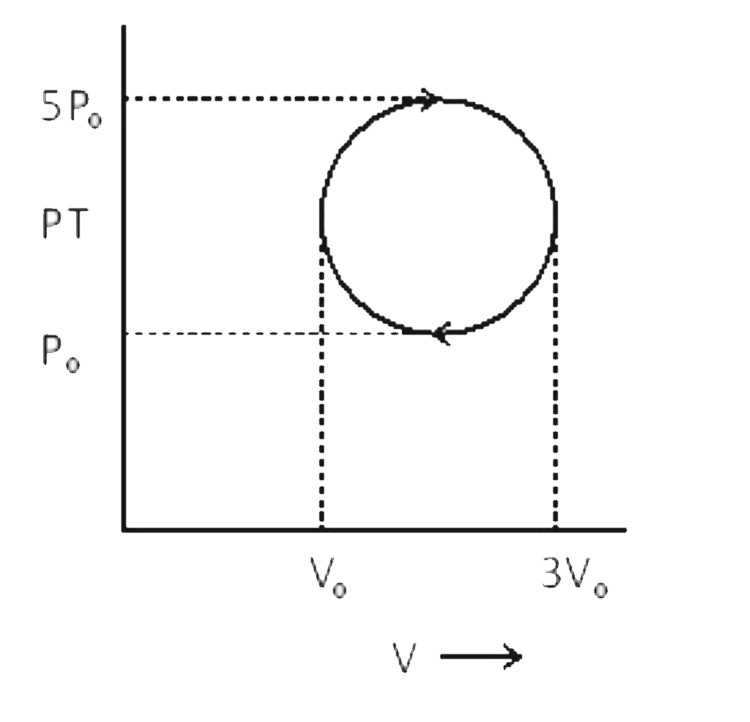
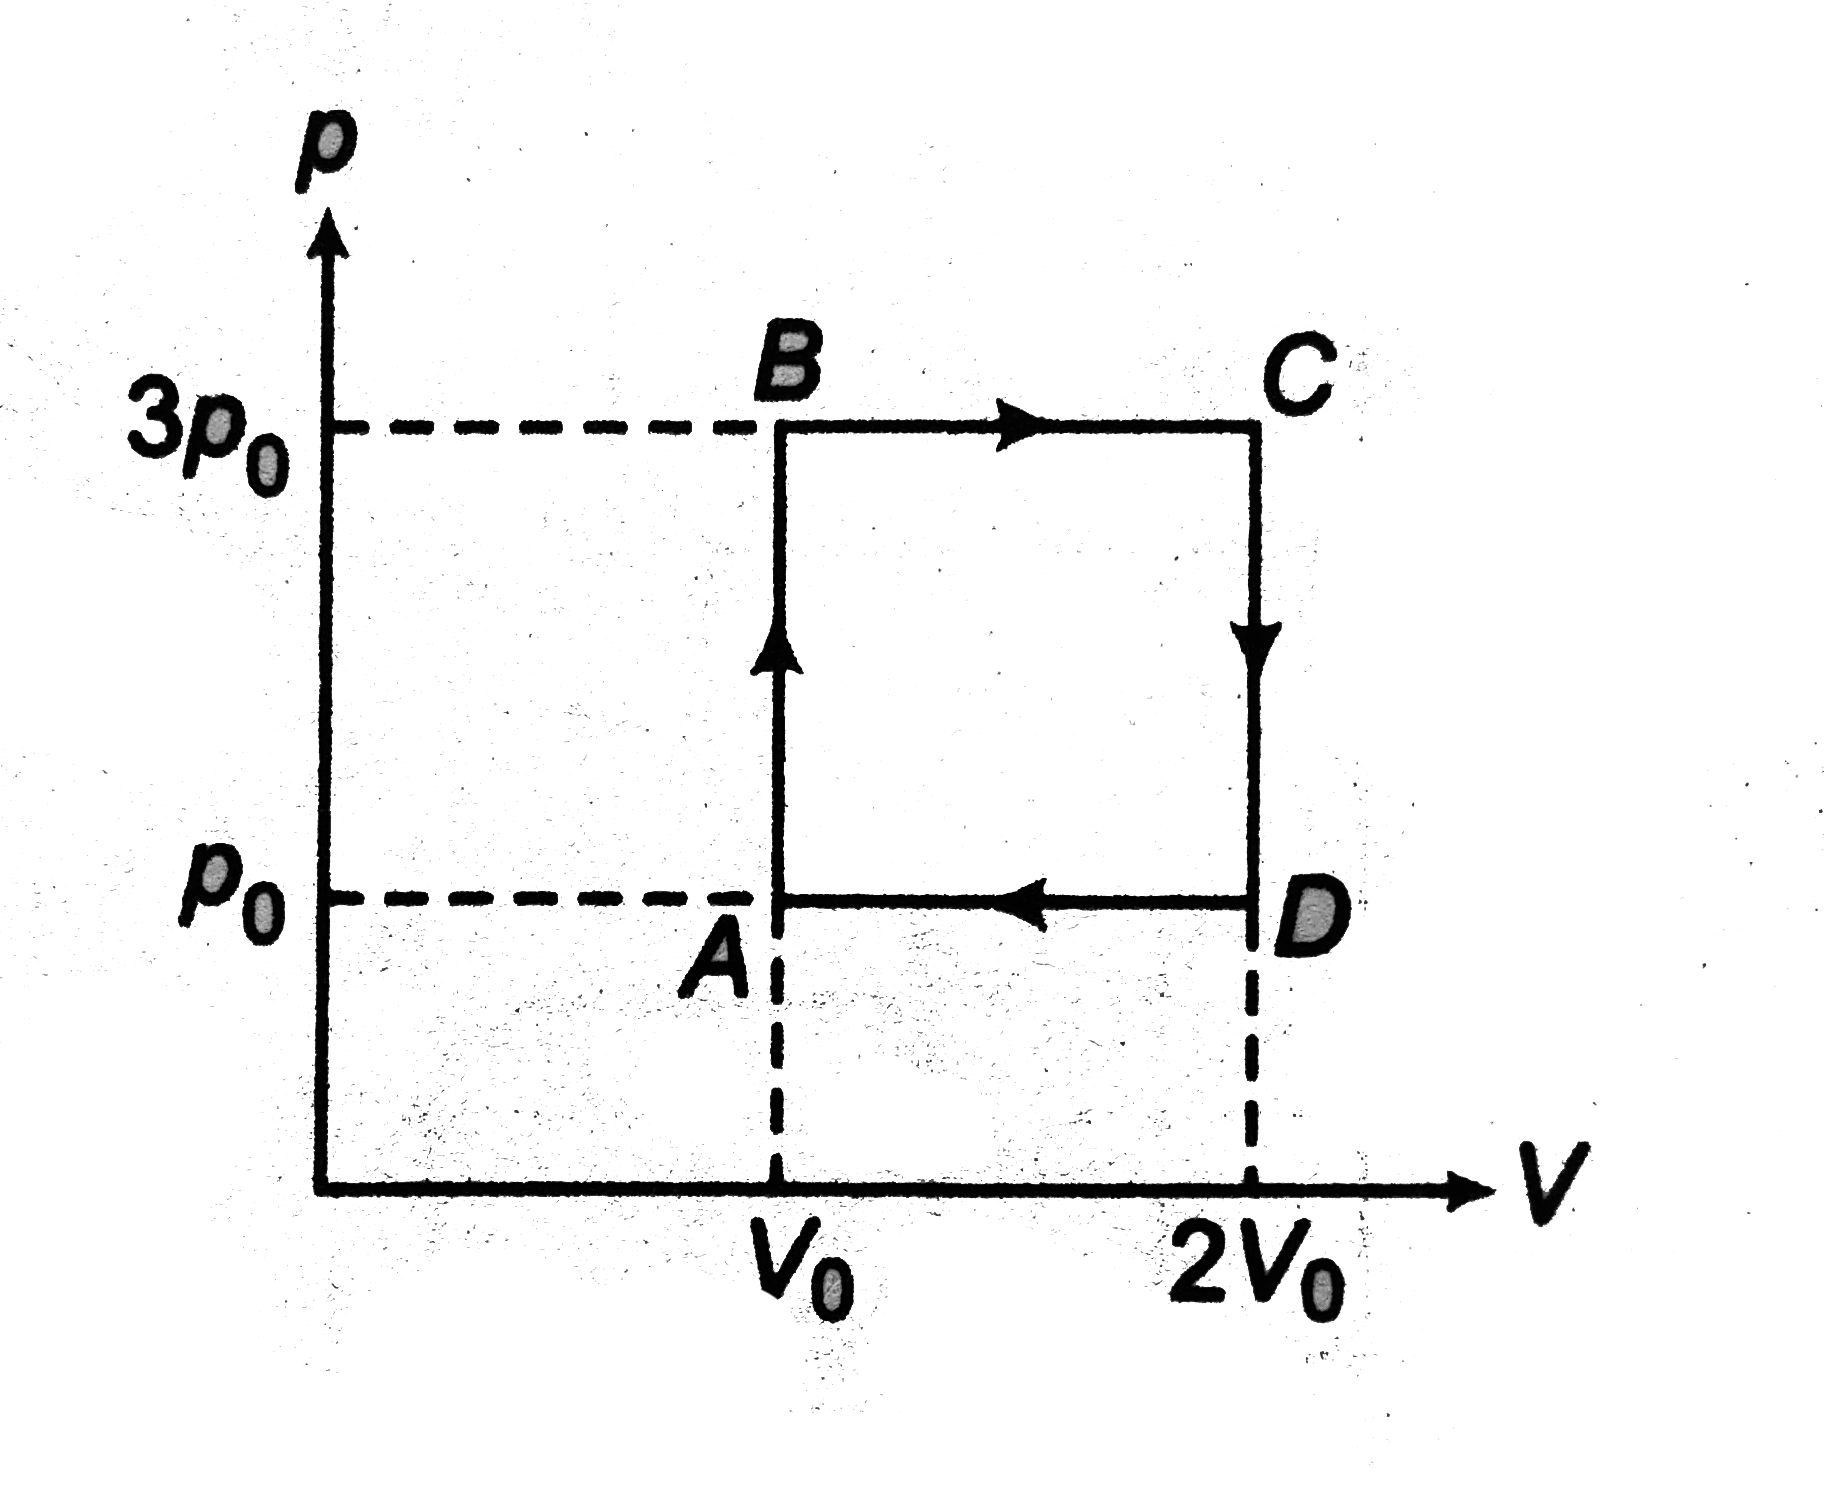
View SolutionAn ideal monoatomic gas is carried around the cycle ABCDA as shown in the figure. The efficiency of the gas cycle is
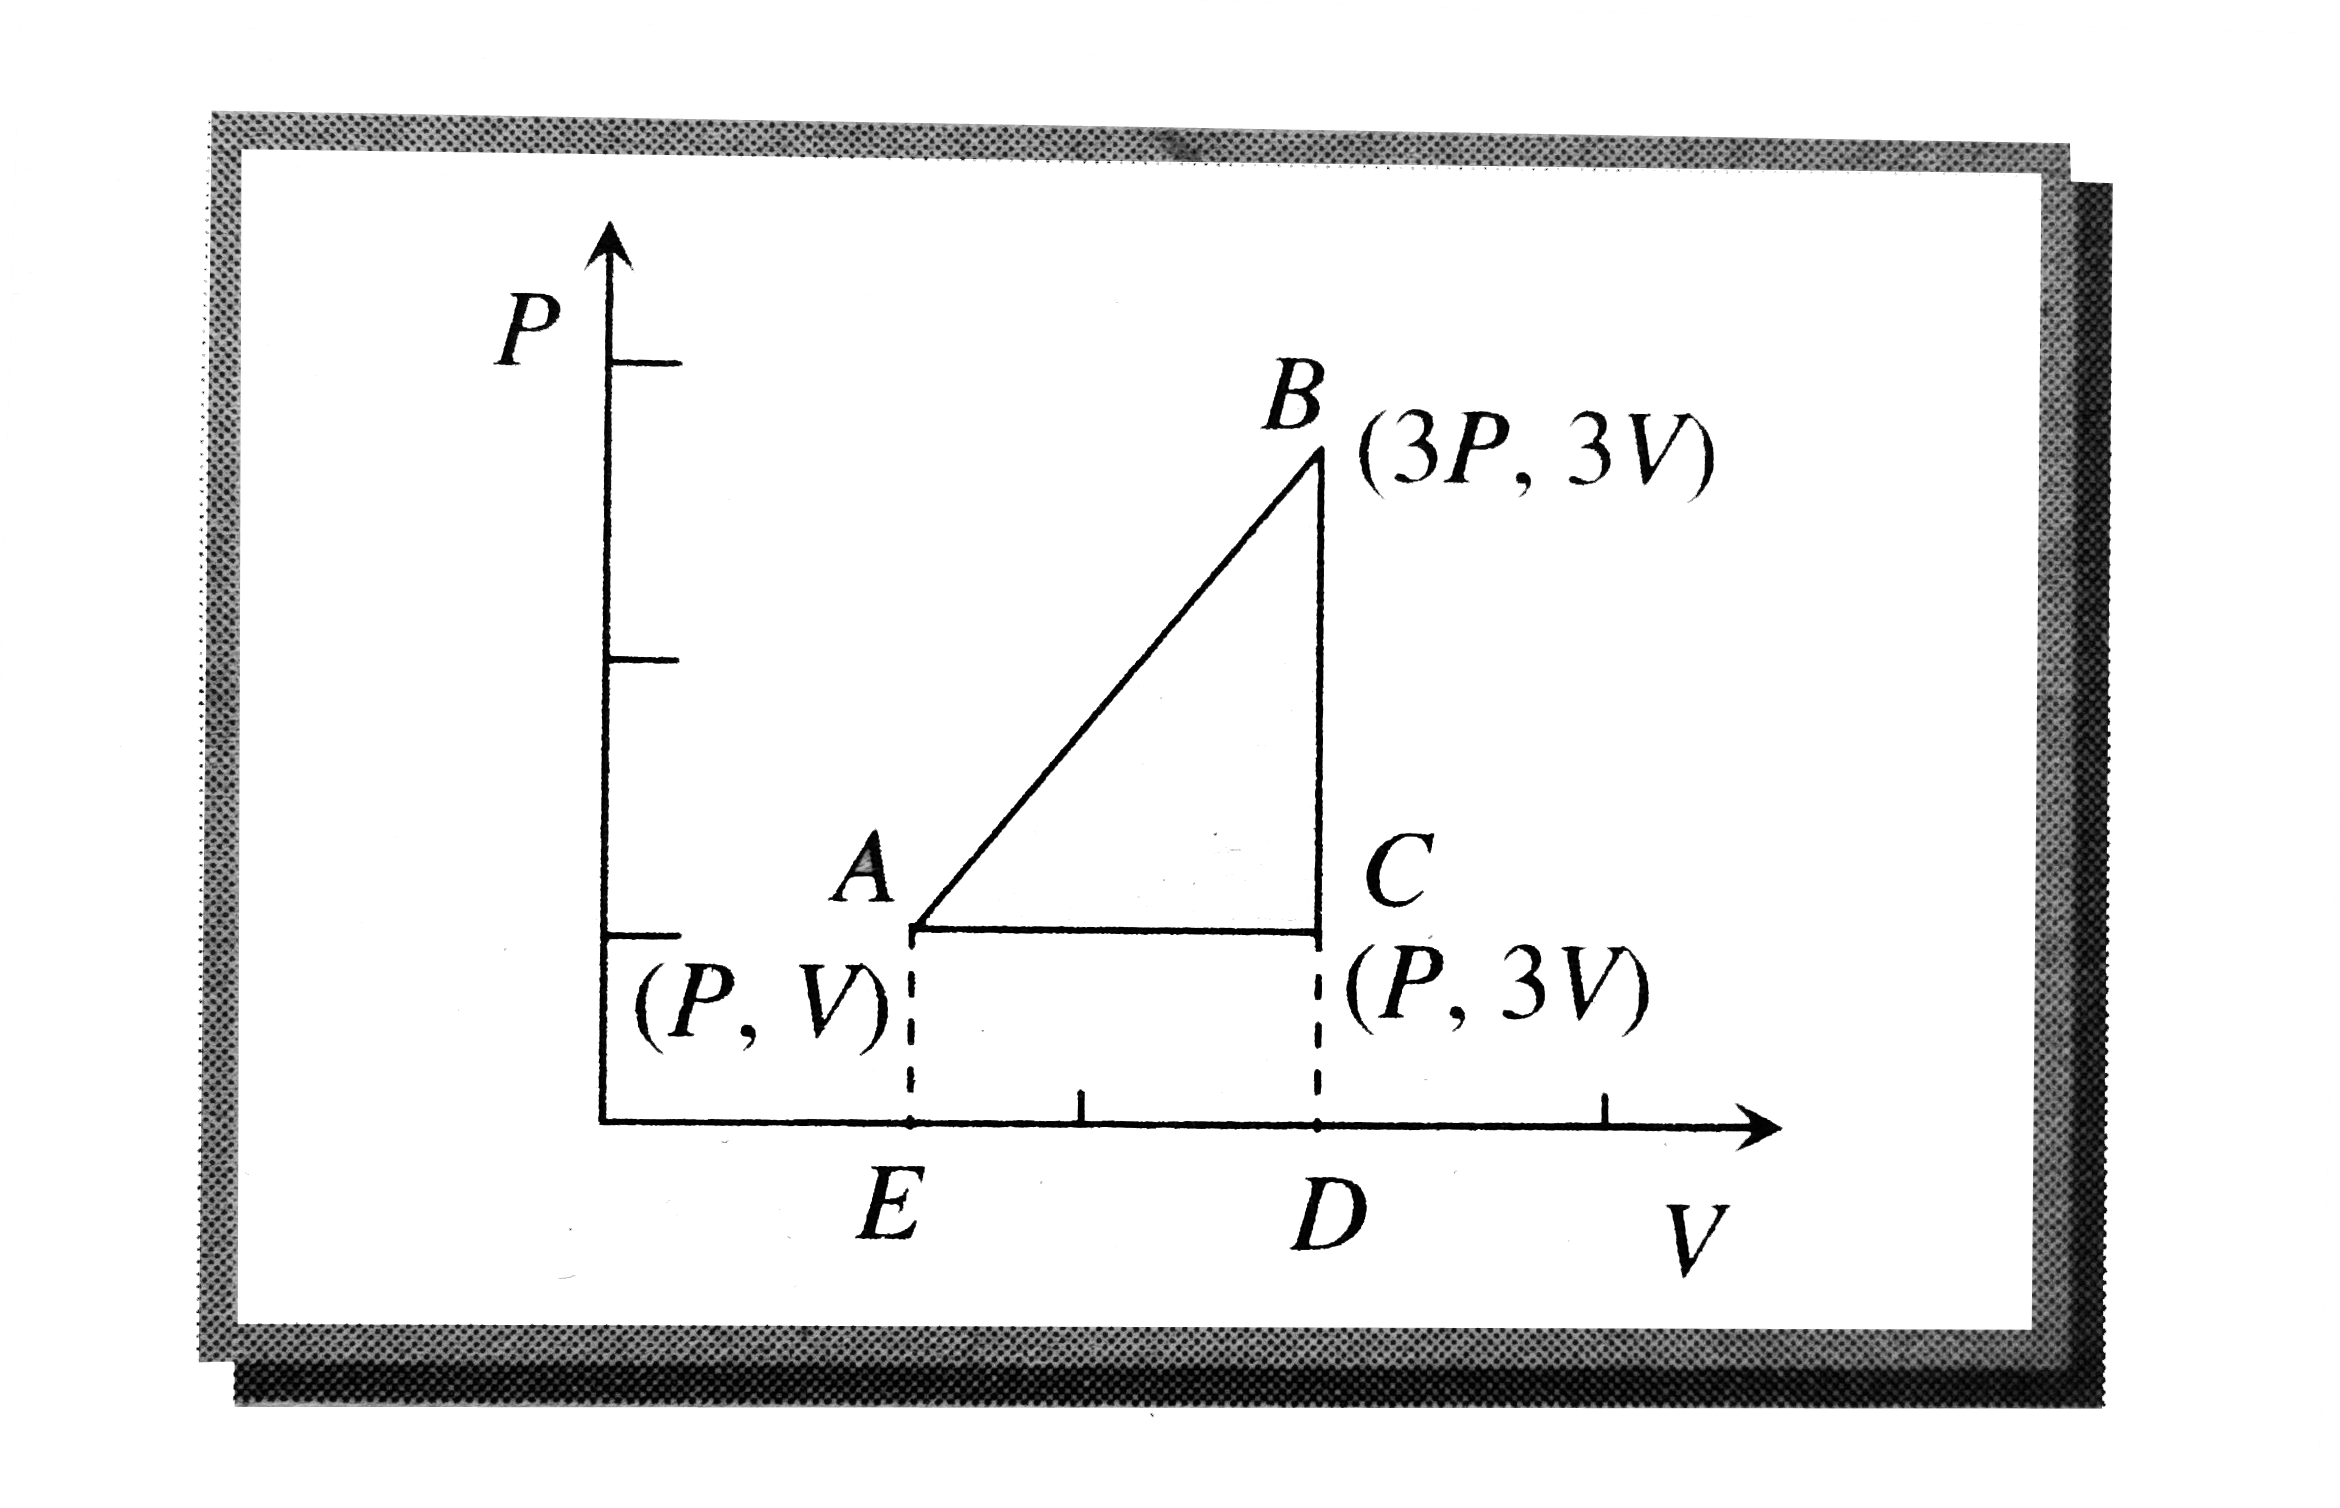
View SolutionAnideal gas is taken around ABCA as shown in the above P−V diagram. The work done during a cycle is
View SolutionA sample of an ideal monoatomic gas is taken round the cycle ABCA as shown in the figure the work done during the cycle is
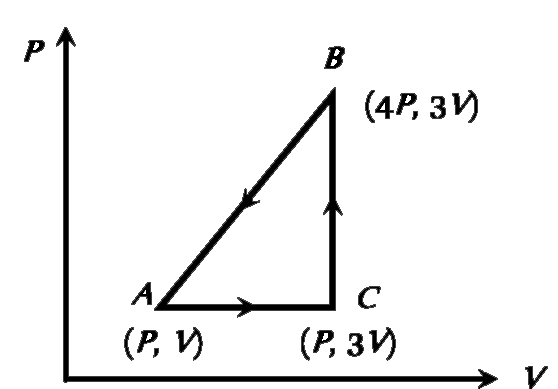
View SolutionAn ideal gas is taken around ABCA as shown in the above P - V diagram. The work done during a cycle is
View Solution
