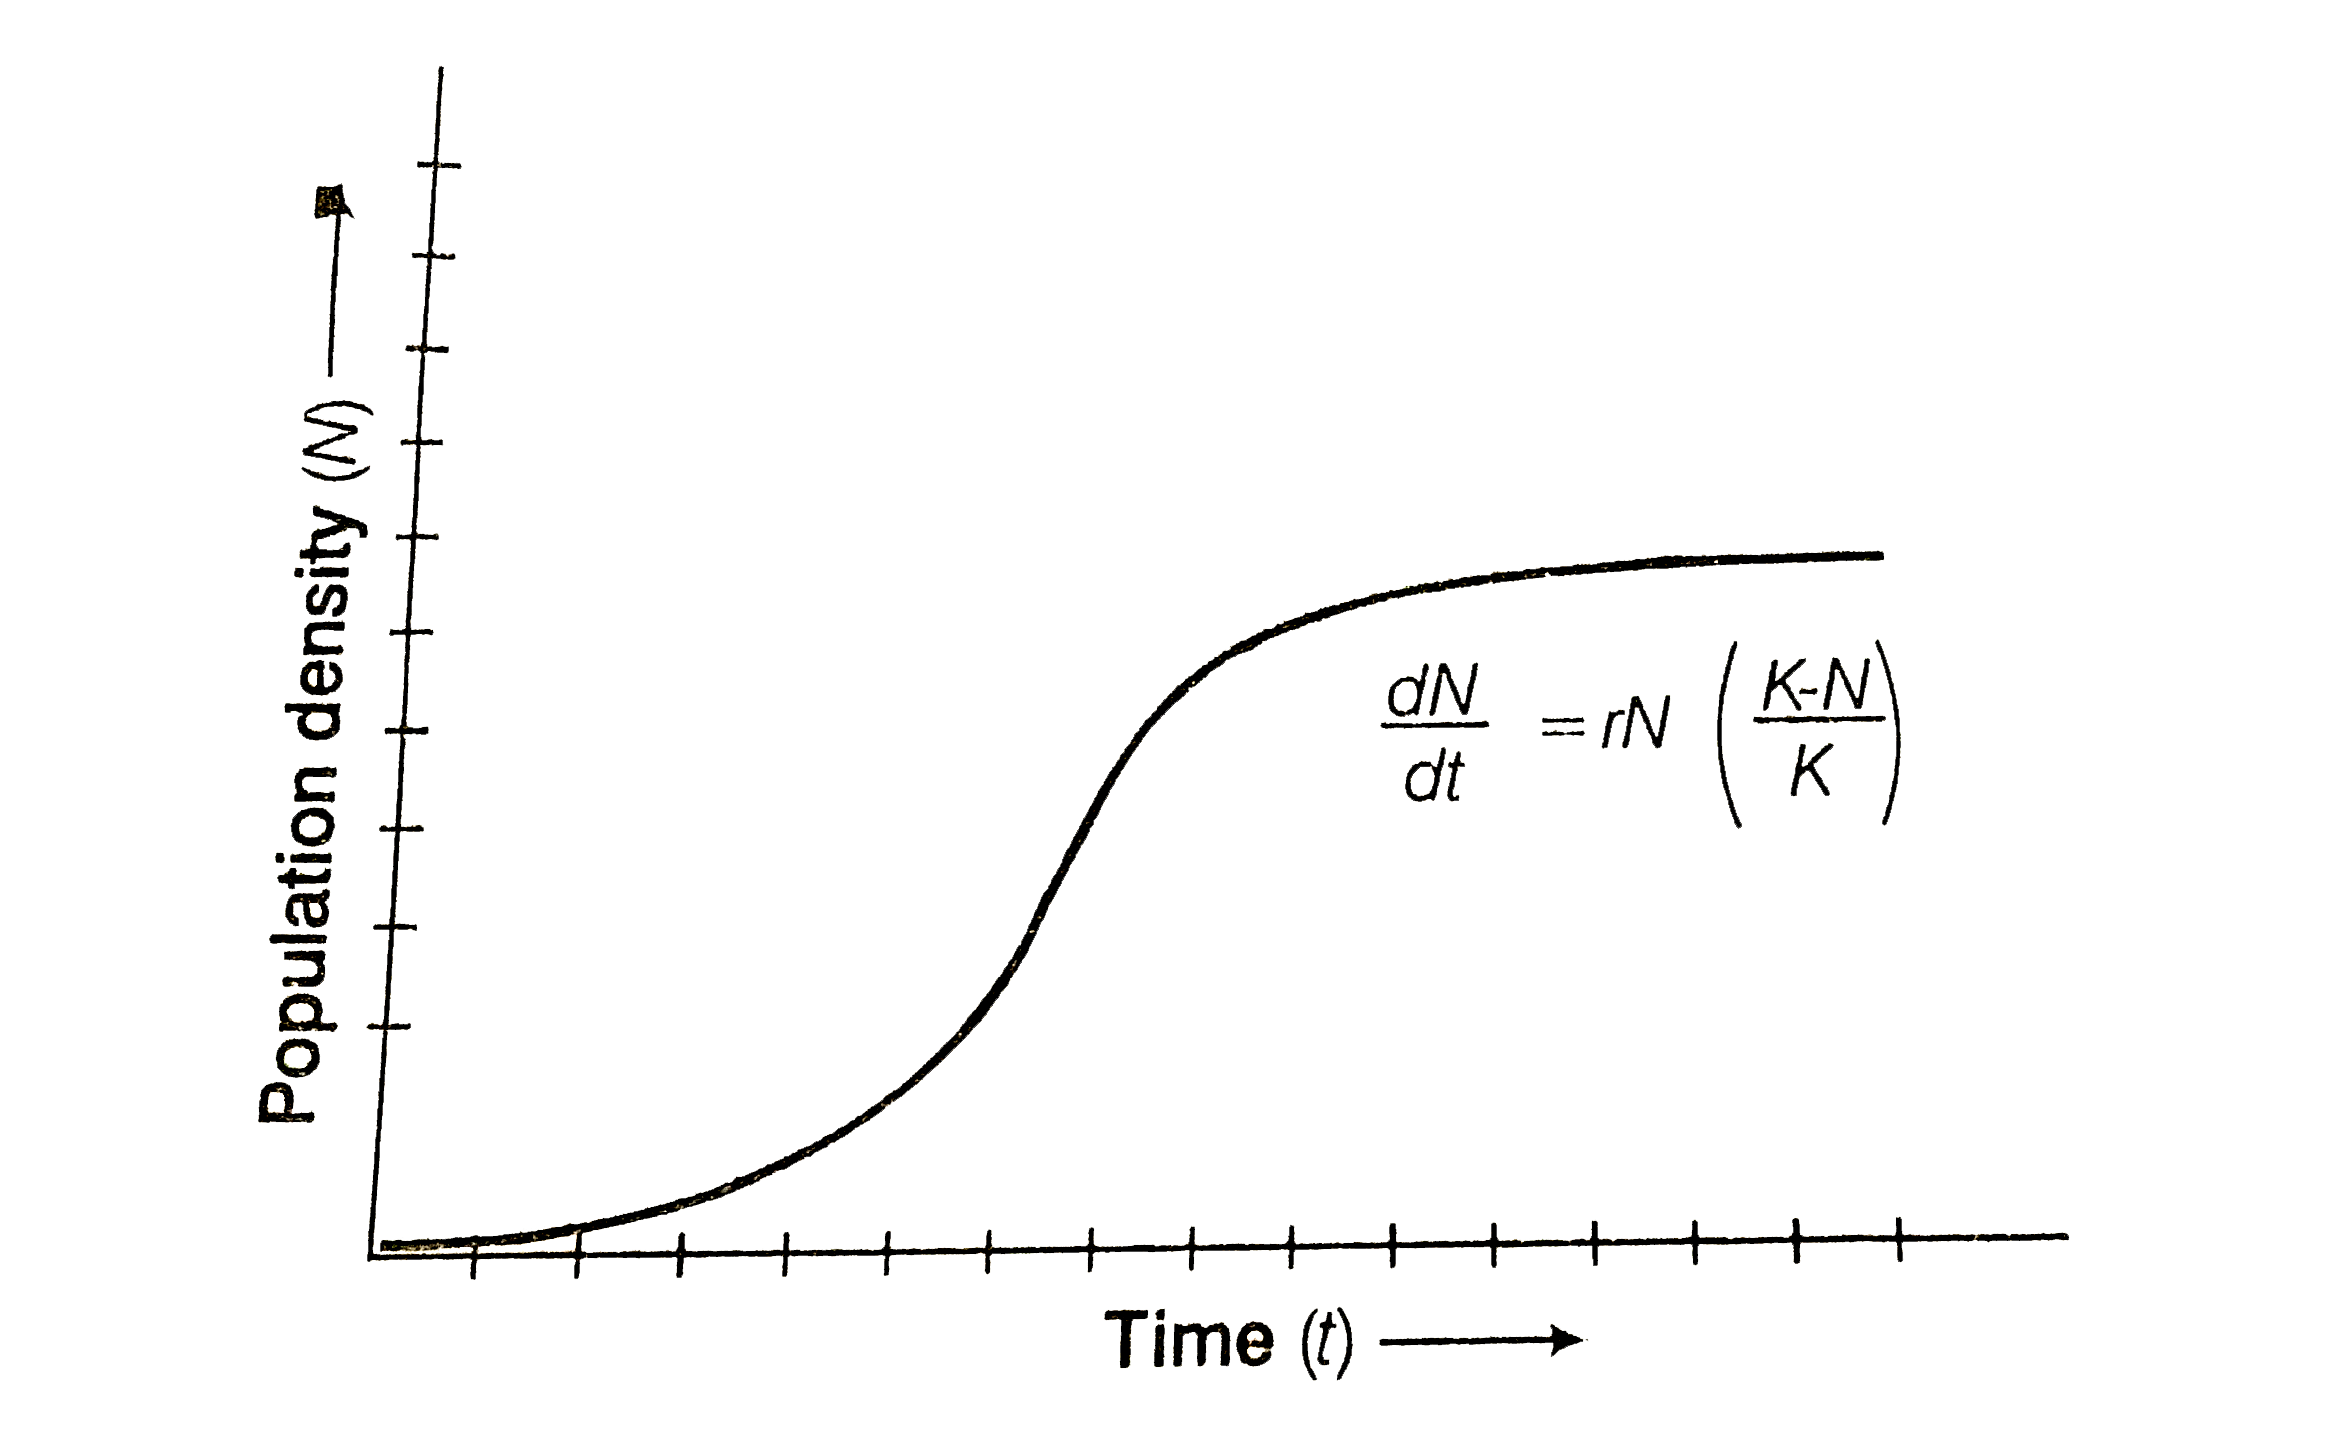
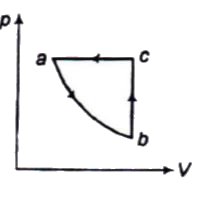
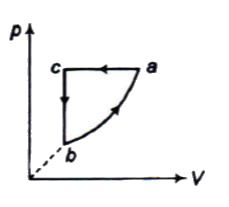
The V-T curve for the given process is given below. What will be its following P-V curve
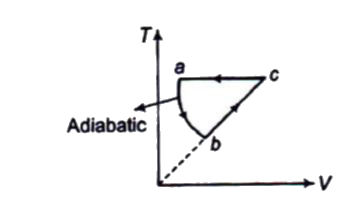
A
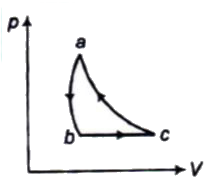
B
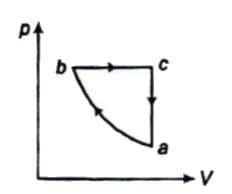
C
D
Video Solution
Text Solution
The correct Answer is:A
Process ab is adiabatic expansion. So pressure in the process decreases as
p=kv(γ>1)
Process BC is straight line passing through origin that means T = kV. From ideal gas equation, T = (pnR)V
So pressure during the process must be constant. Process ca is isothermal. Final p-V graph will have three sections :
(1) isothermal (2) adiabatic (3) isobaric
|
Topper's Solved these Questions
Similar Questions
Knowledge Check
An ideal gas is subjected to a cyclic process ABCD as depicted in the P-V diagram given below
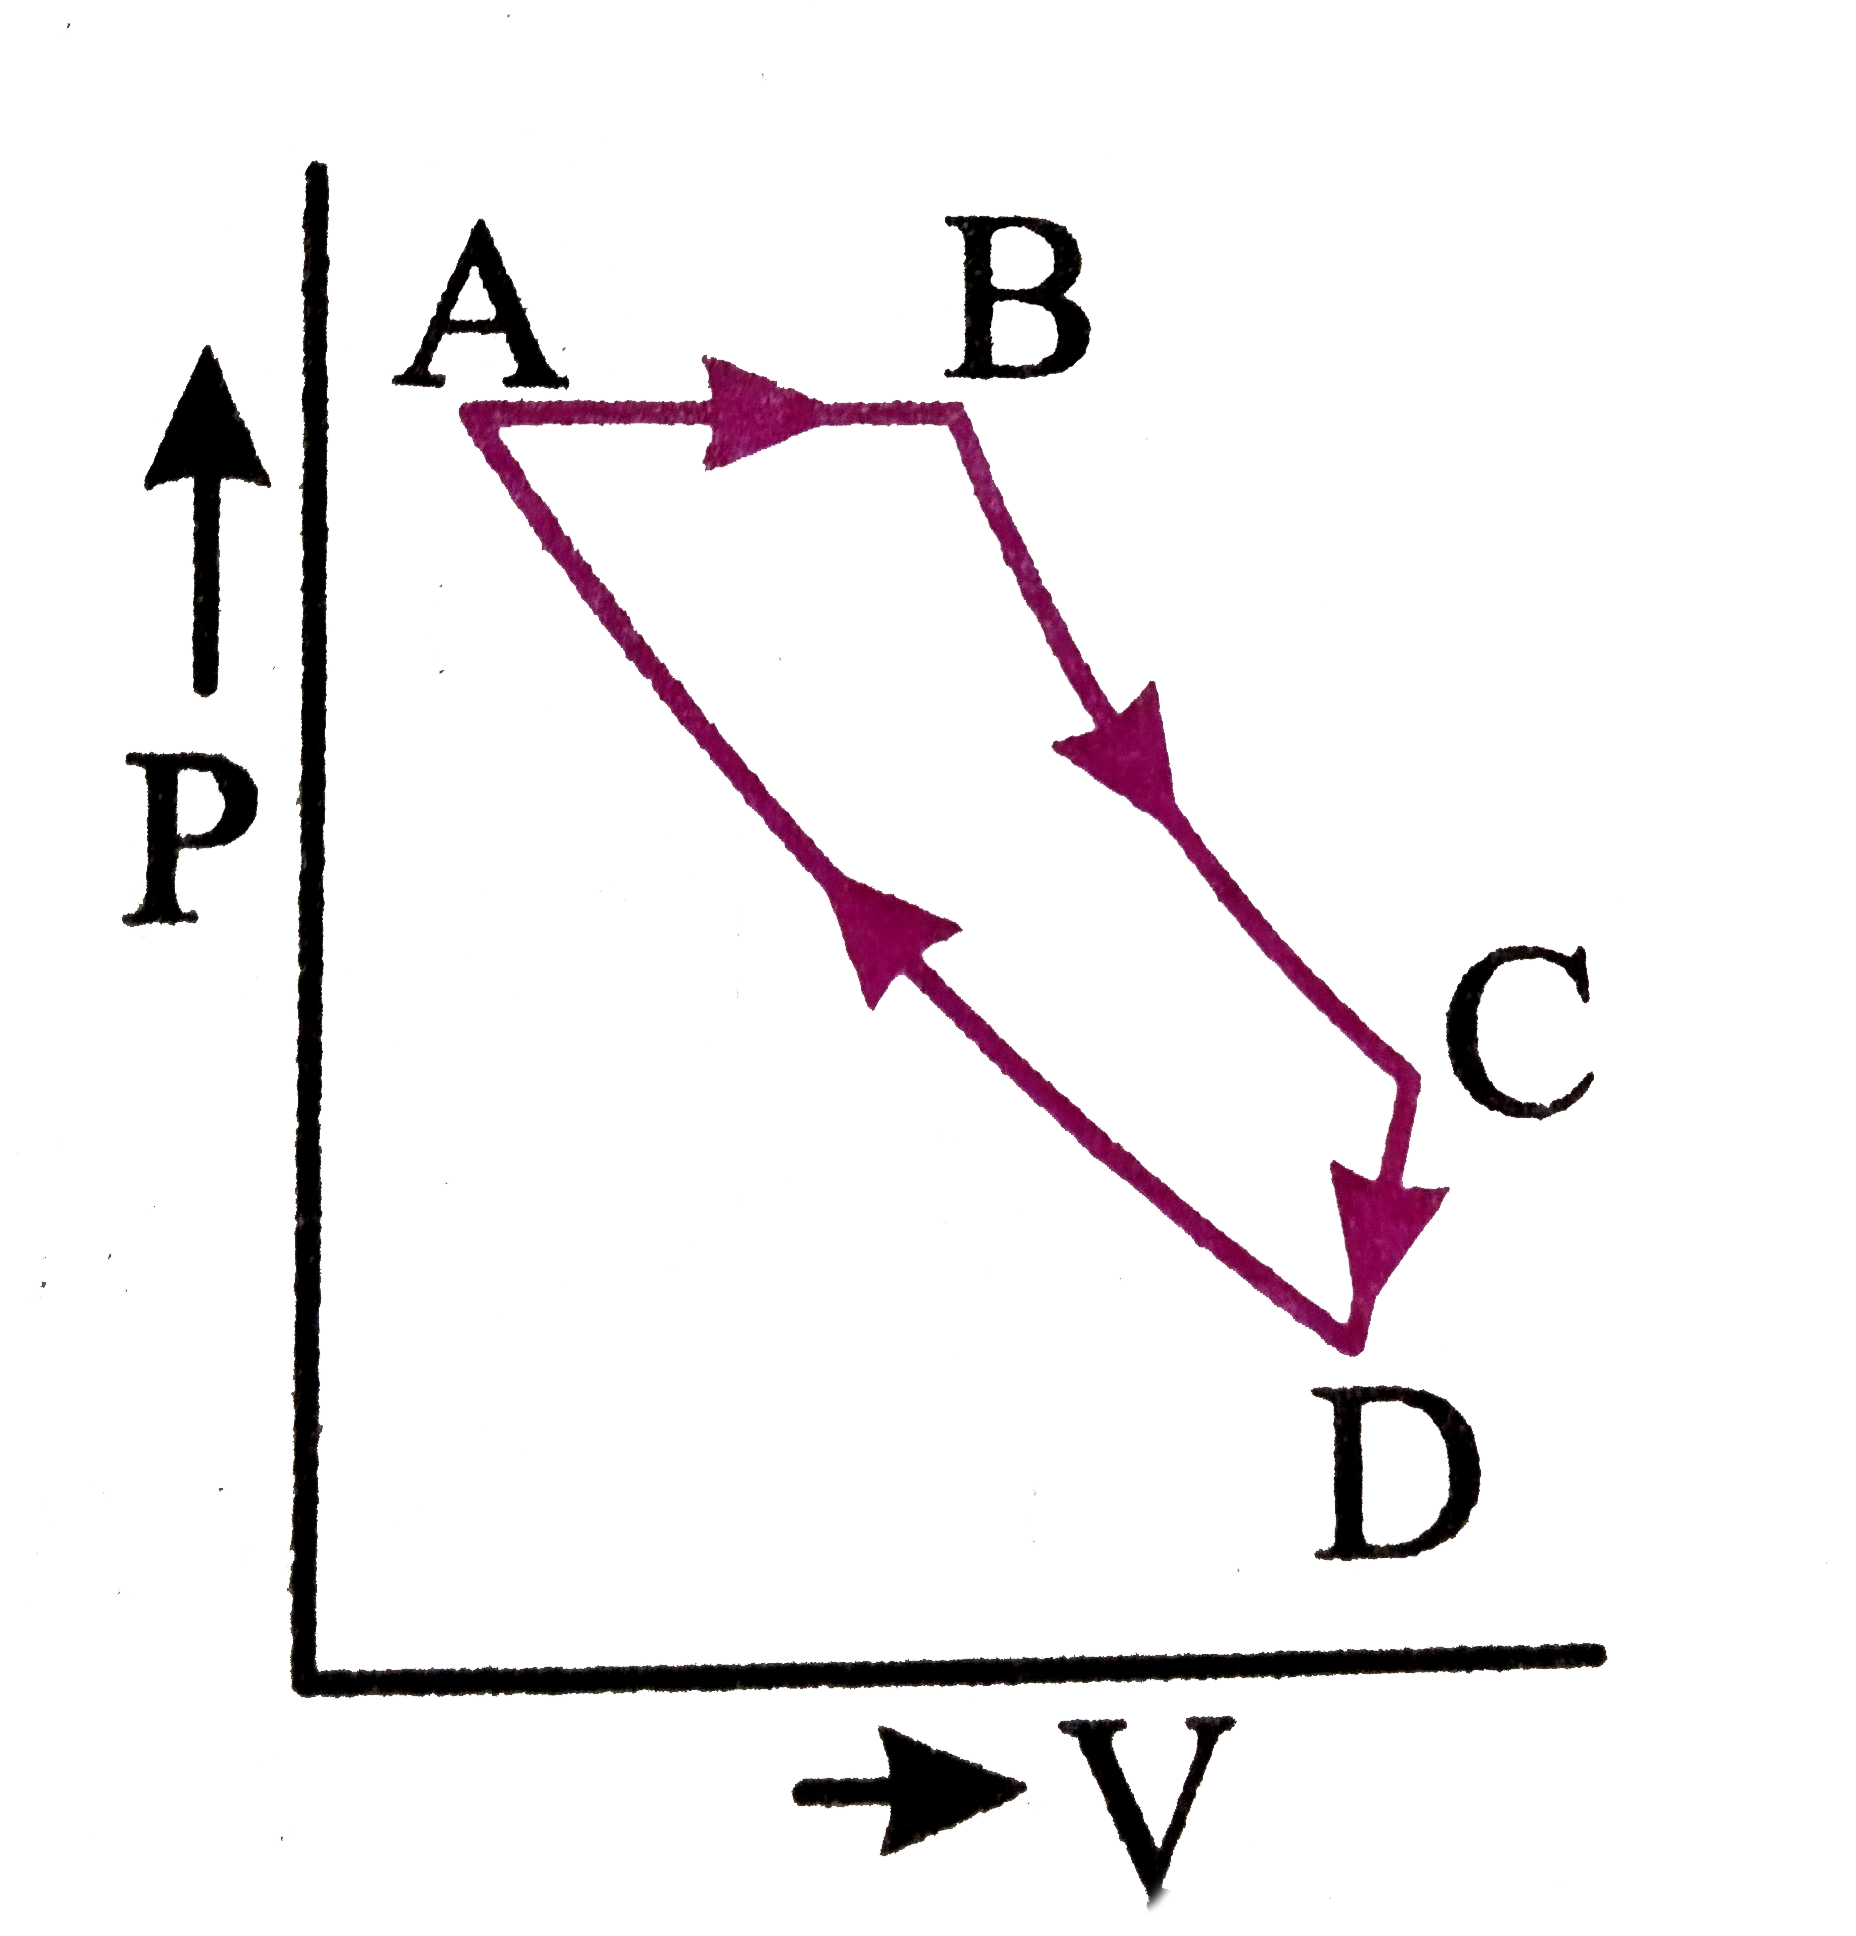
Which of the following curves represents the equivalent cyclic process?A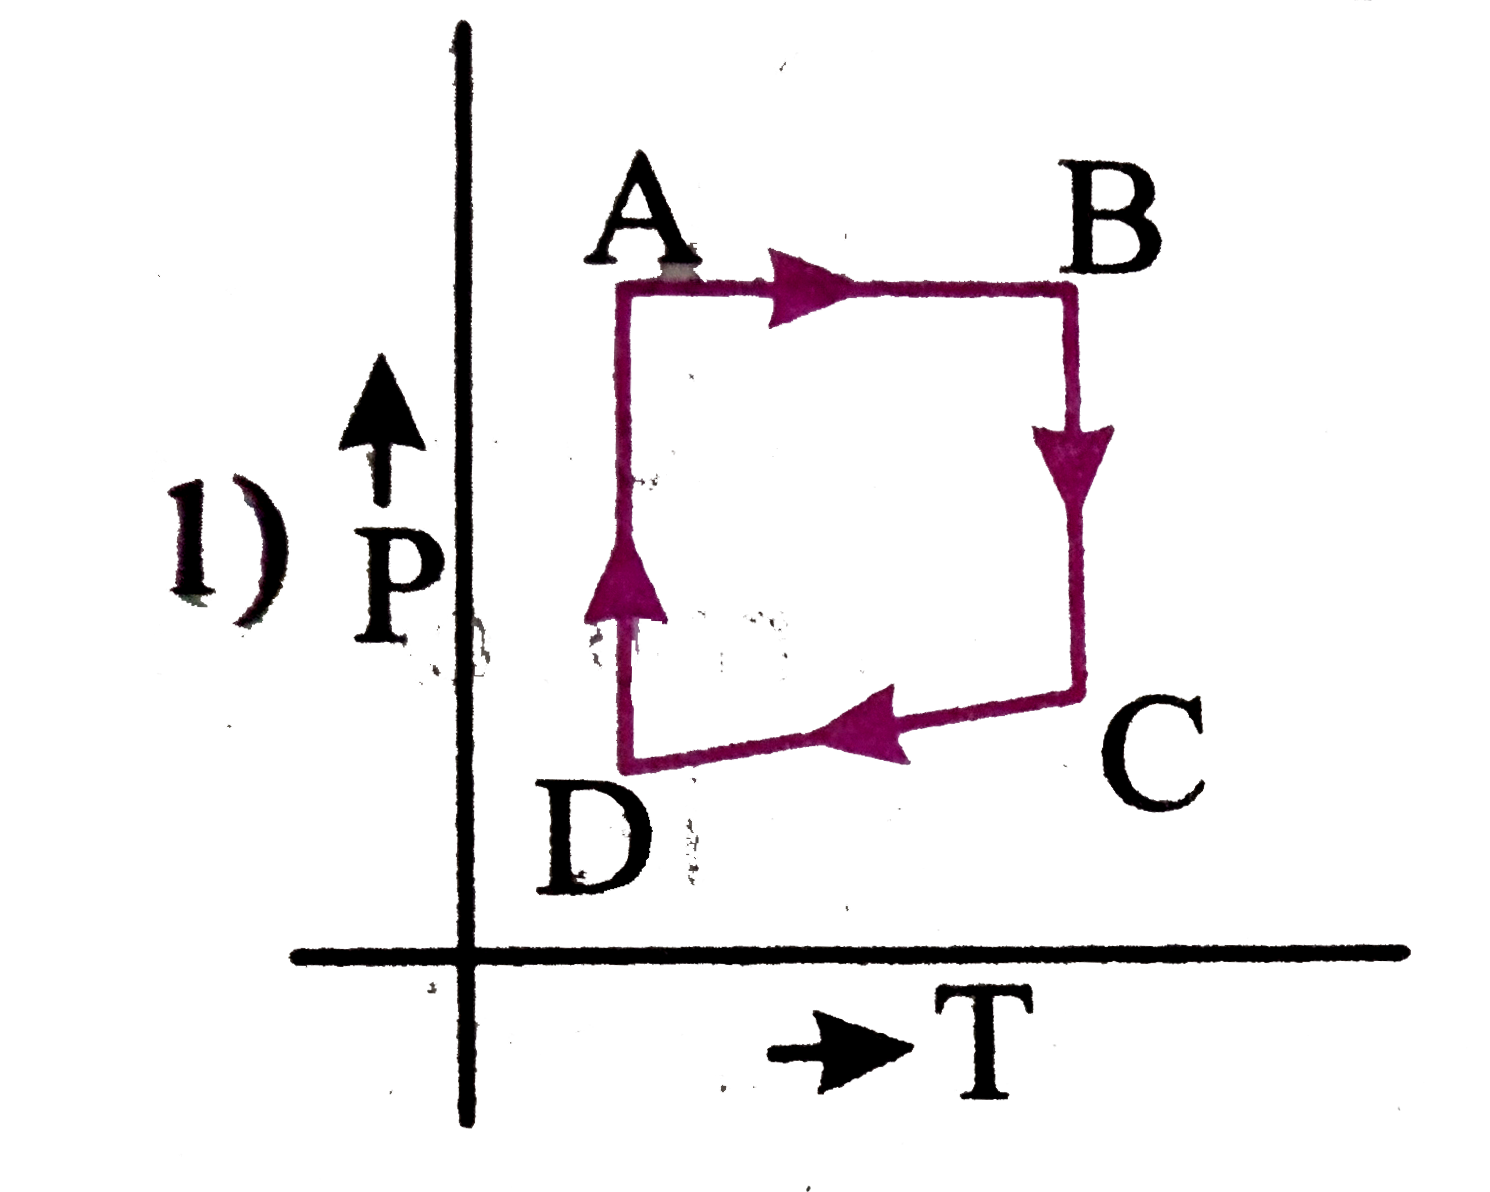 B
B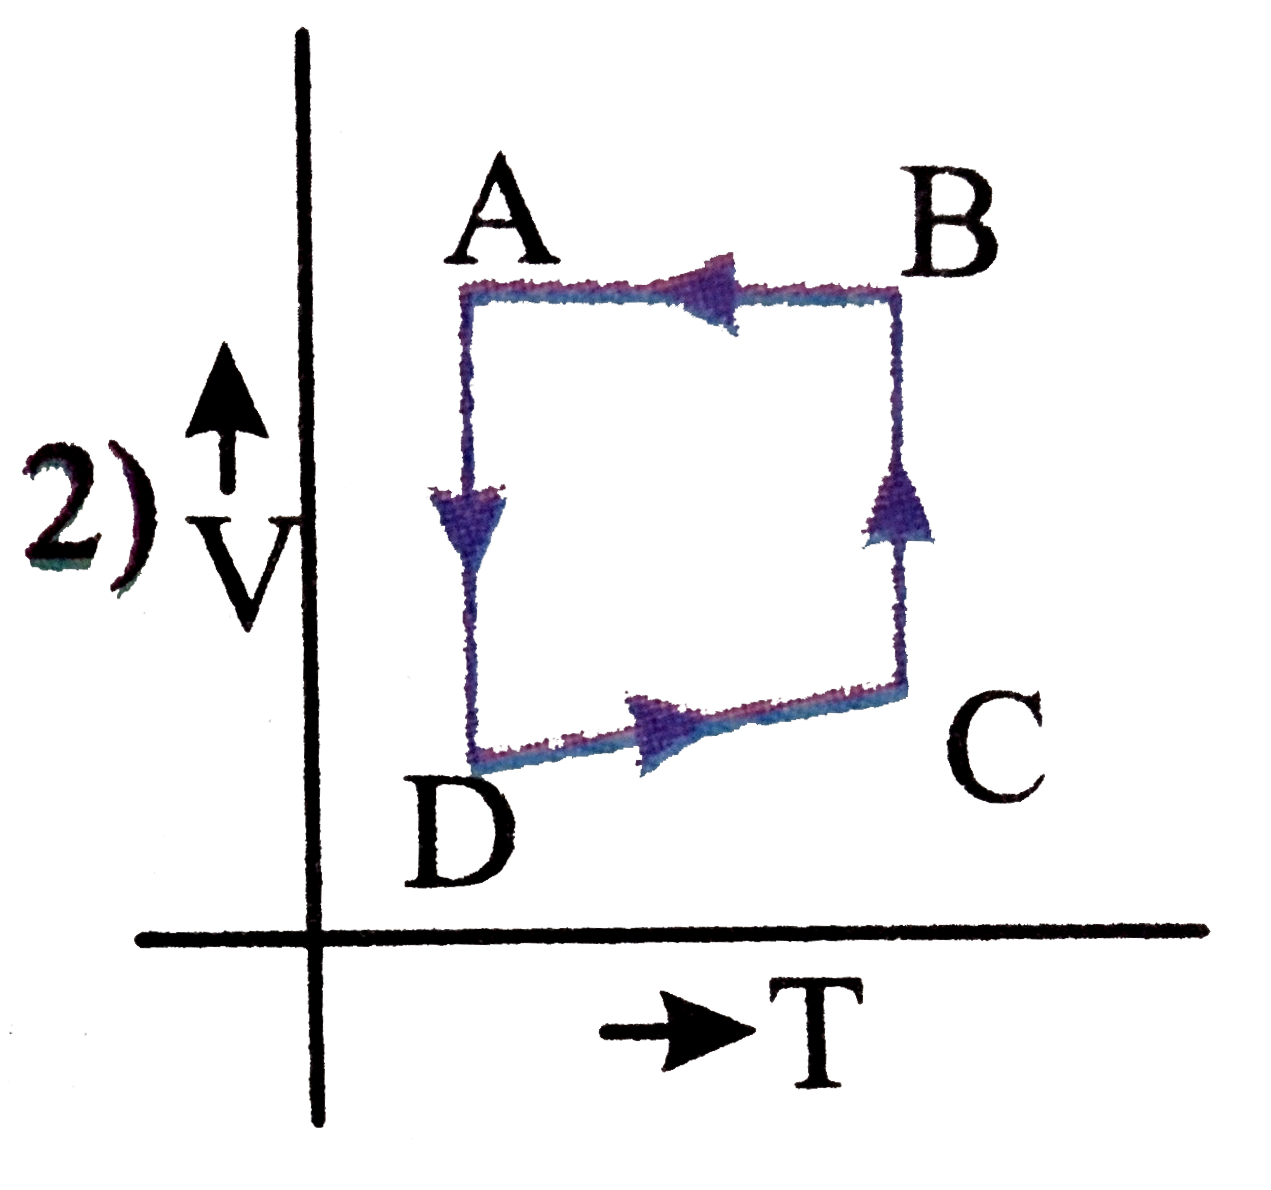 C
C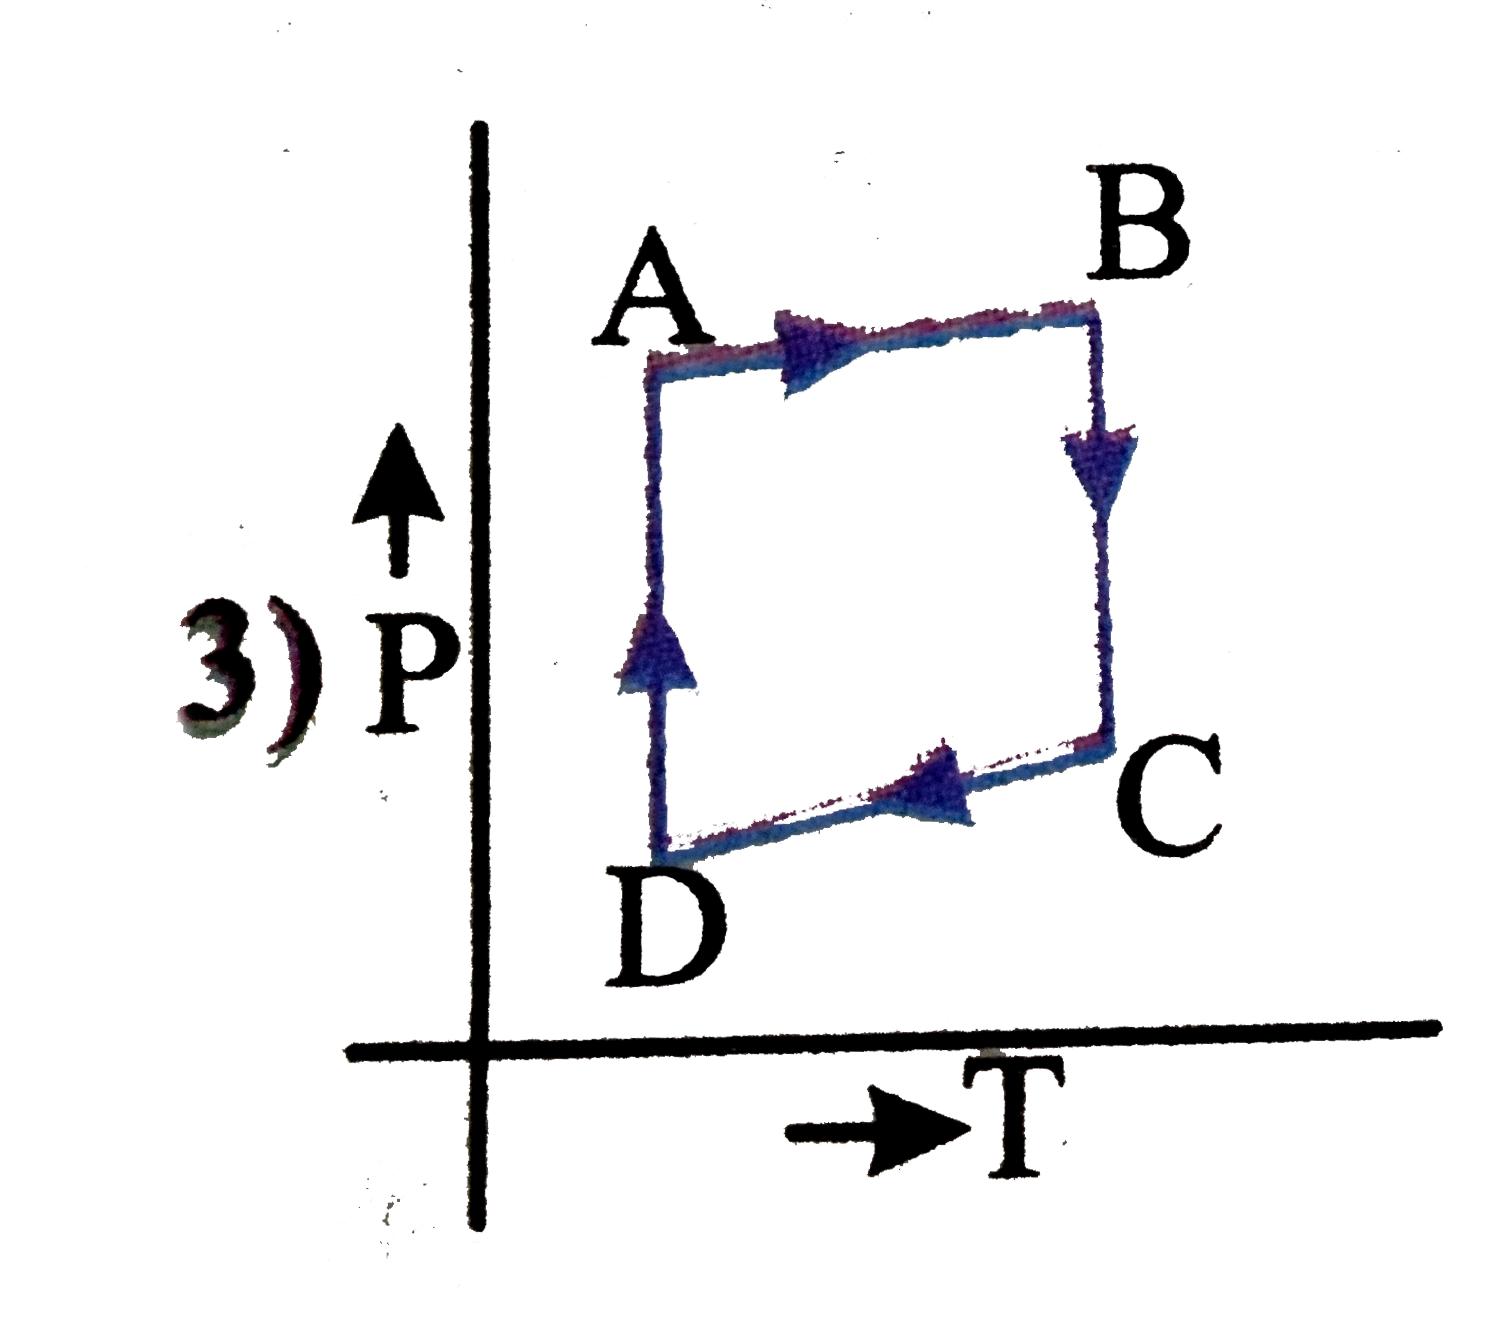 D
D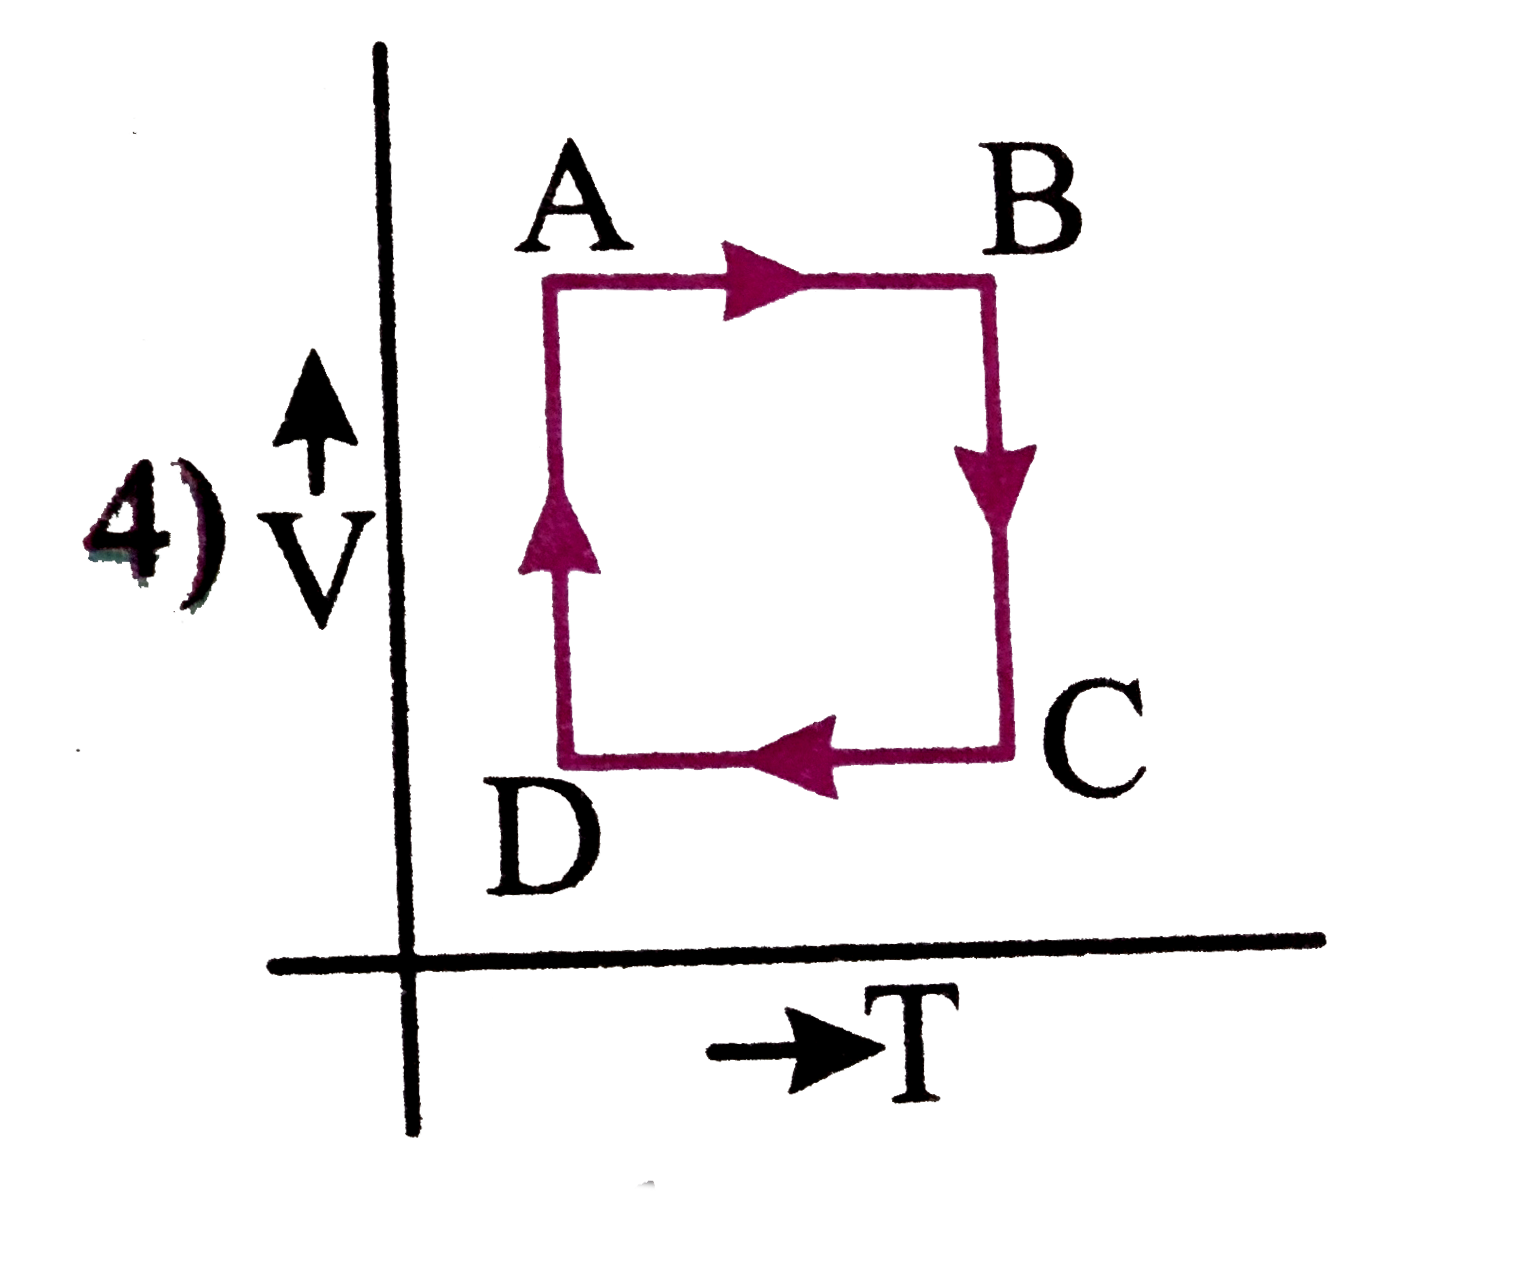
1 mol of an ideal gas undergoes different thermodynamical process in P−V diragram given below :
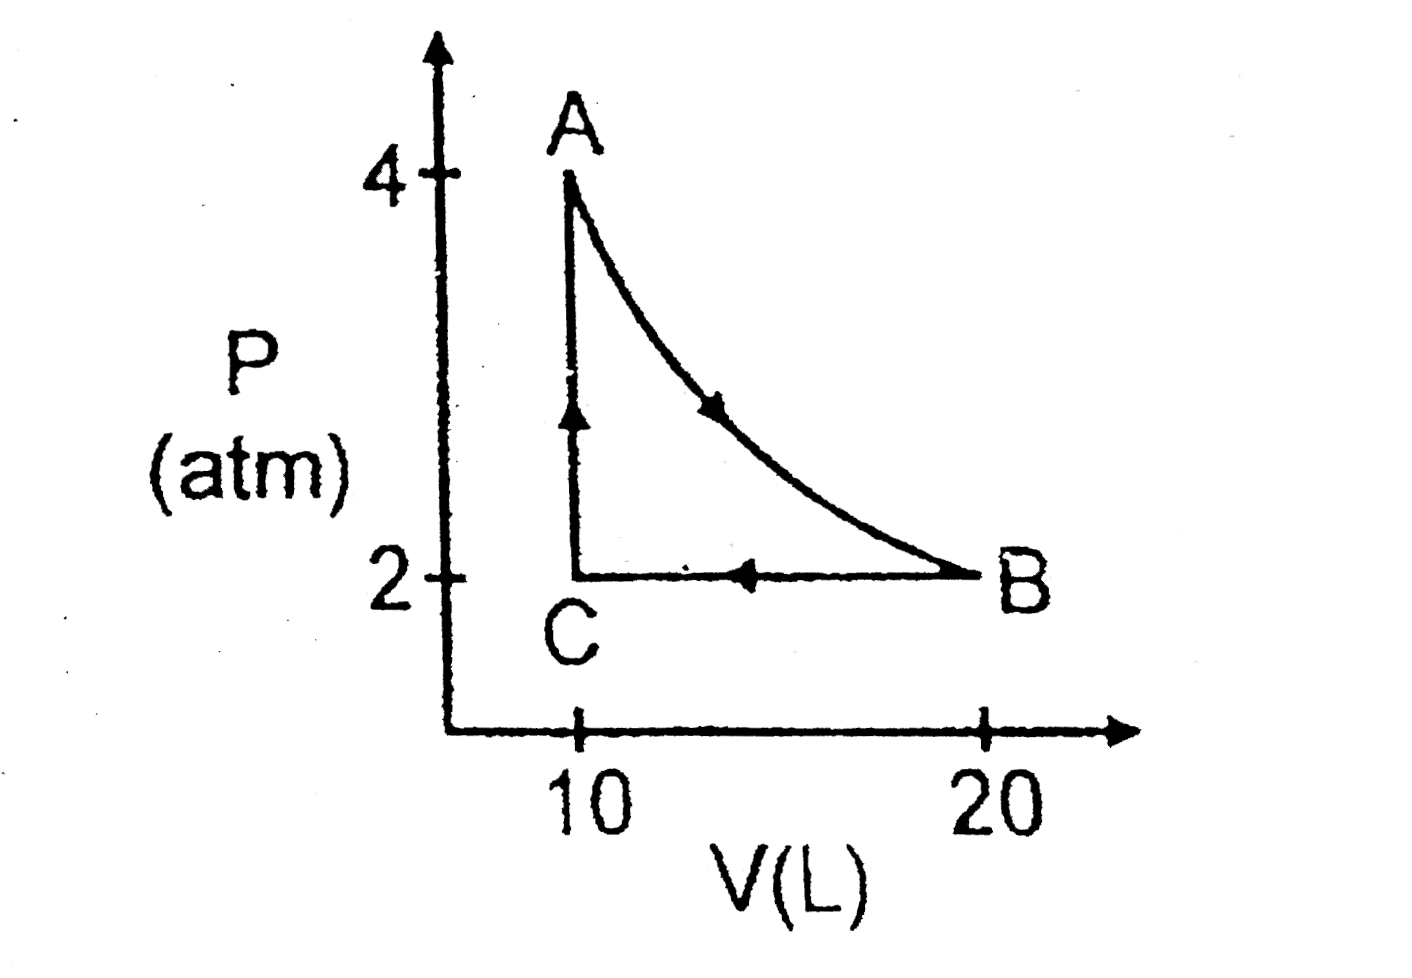
What will be the value of ΔH and ΔE for overall process ?AΔH=0BΔE=0CΔH=48.4 calorieDΔE=13.82 calorie
Draw at P-T curve for isobaric process.
View SolutionDraw at P-T curve for isochoric process.
View SolutionDraw at P-T curve for isobaric process.
View SolutionIn the given x−t curve,
View SolutionDraw a Lorenz curve of the data given below:

View SolutionThe given P-V curve is predicted by
View Solution
