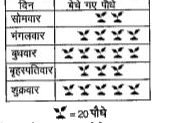
निम्न चित्रालेख एक नर्सरी द्वारा सोमवार से शुक्रवार तक बेचे गए पौधों की संख्या को दर्शाता है

सोमवार से शुक्रवार तक बेचे गए कुलपौधों की संख्या है
19
190
250
380
The correct Answer is:D
Step by step video, text & image solution for निम्न चित्रालेख एक नर्सरी द्वारा सोमवार से शुक्रवार तक बेचे गए पौधों की संख्या को दर्शाता है सोमवार से शुक्रवार तक बेचे गए कुलपौधों की संख्या है by Maths experts to help you in doubts & scoring excellent marks in Class 6 exams.
Updated on:21/07/2023Similar Questions
The inequation represented by the graph given below is :
View SolutionThe inequation that best describes the graph given below is _________
View SolutionThe inequation that best describes the following graph is _________
View SolutionWhich inequations represent the shaded region in the given figure
View SolutionMatch the followings (column I with column II)
ltimg src="https://d10lpgp6xz60nq.cloudfront.net/physics_images/NCERT_BIO_XI_C03_E01_011_Q01.png" width="80%"gt
View SolutionAverage rainfall on Monday, Tuesday, Wednesday and Thrusday is 420.5 cm and average on Tuesday, Wednesday, Thursday and Friday is 440.5 cm. If the ratio of rainfall for Monday and Friday is 20:21,find the rainfall (in cm) on Monday and Friday. सोमवार, मंगलवार, बुधवार तथा गुरूवार की ओसत वर्षा 420.5 सेमी है. और मंगलवार,बुधवार, गुरूवार तथा शुक्रवार को 440.5 सेमी है। तद्नुसार, यदि सोमवार तथा शुक्रवार को वर्षा का अनुपात 20 : 21 रहा हो, तो सोमवार तथा शुक्रवार को क्रमशः कितने सेमी वर्षा हुई है।
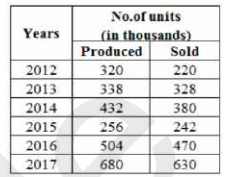
View SolutionThe table given below shows the number of units of a product produced and sold by a company in 6 years.
निम्न तालिका एक कंपनी द्वारा छह वर्षों के दौरान उत्पादित और बेचे गए उत्पाद की यूनिटों की संख्या दर्शाती है| The number of units sold in 2016 is approximately what percent more than the average number of
units produced from 2012 to 2016?
2016 में बेची गई उत्पाद के यूनिटों की संख्या, 2012 से लेकर 2016 तक उत्पादित औसत यूनिटों की संख्या से लगभग कितने प्रतिशत अधिक है ?
View SolutionThe given table represents the number of computers sold by four dealers A,B, C and D during the first six months of 2016. Study the table carefully and answer the questions that follows: दी गयी तालिका चार विक्रेताओं A, B, C और D के द्वारा 2016 के पहले छः महीनों में बेचे गए कंप्यूटरों की संख्या दर्शाती है | इस तालिका का ध्यानपूर्वक अध्ययन करें तथा पूछे गए प्रश्नों का उत्तर दें | The number of months, in which the number of computers sold by dealer B was less than the average number of computers sold by dealer C over six months, was: / ऐसे कितने महीने हैं, जिनमें विक्रेता B के द्वारा बेचे गए कंप्पूटरों की संख्या इन छः महीनों में विक्रेता C के द्वारा बेचे गए कंप्यूटरों की औसत संख्या से कम है ?
View Solution
