Maximum day time temperatures of Hyderabad in a week (from 26th February to 4th March, 2011) are recorded as26∘C,27∘C,30∘C,30∘C,32∘C,33∘C and 32∘C : What is the maximum temperature of the week?Solution in Telugu
The correct Answer is:33∘C
Step by step video, text & image solution for Maximum day time temperatures of Hyderabad in a week (from 26th February to 4th March, 2011) are recorded as 26^@C , 27^@C , 30^@C , 30^@C , 32^@C , 33^@C and 32^@C : What is the maximum temperature of the week? by Maths experts to help you in doubts & scoring excellent marks in Class 7 exams.
Topper's Solved these Questions
- BOOK - NCERT TELUGUCHAPTER - DATA HANDLINGEXERCISE - Exercise - 211videos
DATA HANDLING
- BOOK - NCERT TELUGUCHAPTER - DATA HANDLINGEXERCISE - Exercise - 317videos
DATA HANDLING
- BOOK - NCERT TELUGUCHAPTER - DATA HANDLINGEXERCISE - Do This2videos
DATA HANDLING
- BOOK - NCERT TELUGUCHAPTER - CONSTRUCTION OF TRIANGLESEXERCISE - EXERCISE -55videos
CONSTRUCTION OF TRIANGLES
- BOOK - NCERT TELUGUCHAPTER - EXPONENTSEXERCISE - EXERCISE-34videos
EXPONENTS
Similar Questions
Long jumps by 7 students of a team are 98cm, l25cm, l40cm, 155cm, l74cm, l40cm and l55cm. Find the mode of the data.
02:08View SolutionSay true or false and why? The difference between the largest and smallest observations in a data set is called the mean.
04:41View SolutionIn a unit test Amar secured 20, 18, 23, 21, 24 and 22 marks in Telugu, Hindi, English, Mathematics, Science and Social Science respectively. Peter got 23, 21, 20, 19, 24 and 17 marks in the above subjects respectively. Interpret the data in an organized manner.
02:14View SolutionConstruct △ ABC in which AB = 4.5 cm, AC = 4.5 cm and ∠B=50∘. Check whether you get two triangles.
02:18View SolutionExpress the number appearing in the following statements in standard form. The distance between the Earth and the Moon is approximately 384,000,000m.
03:26View Solutionएक सप्ताह के पहले चार दिनों का औसत उच्च तापमान 25∘C है जबकि अंतिम चार दिनों को औसत 25.5∘C है। यदि पुरे सप्ताह का औसत तापमान 25.2∘C है तो चौथे दिन का तापमान है-
02:26View SolutionThe following article shows the predicted temperature and actual temperature for each day of a week: (a) On which day was the predicted temperature and actual temperature the same? (b) What was the maximum temperature predicted in the week? (c) What was the actual minimum temperature in the week? (d) On which day the difference between actual temperature and predicted temperature was maximum?
01:21View SolutionIn a week, temperature of a certain place is measured during winter are as follows 26∘C,24∘C,28∘C,31∘C,30∘C,26∘C,24∘C. Find the mean temperature of the week.
02:25View SolutionIn a week, temperature of a certain place is measured during winter are as follows 26∘C,24∘C,28∘C,31∘C,26∘C,24∘C. Find the mean temperature of the week.
03:24View SolutionThe daily average temperatures in Chennai for the 7 days of a week were recorded. The average temperatures on Sunday, Monday and Tuesday were 20∘C,38∘ C & 32∘ C respectively. The average temperatures on Thursday , Friday and Saturday were 29∘C,22∘Cand30∘C respectively . If the average of average temperatures on the first three days of the week beginning with Sunday equals that of the last four days, find the temperature on Wednesday
04:45View SolutionThe highest temperature recorded daily from January 26 to January 30 were: 7∘C,8∘C,6∘C,3.4∘C and 9.8∘C.
What was the average temperature for these days?02:43View SolutionMaximum day time temperatures of Hyderabad in a week (from 26th February to 4th March, 2011) are recorded as26∘C,27∘C,30∘C,30∘C,32∘C,33∘C and 32∘C : What is the maximum temperature of the week?
02:05View SolutionMaximum day time temperatures of Hyderabad in a week (from 26th February to 4th March, 2011) are recorded as26∘C,27∘C,30∘C,30∘C,32∘C,33∘C and 32∘C : What is the average temperature of the week?
04:41View SolutionThe temperature of a body falls from 40∘C to 30∘C in 10 minutes. If temperature of surrounding is 15∘C, then time to fall the temperature from 30∘C to 20∘C
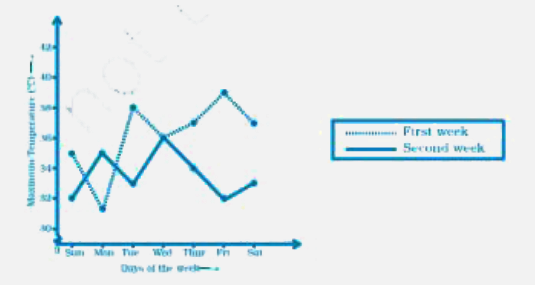
03:01View SolutionThe graph shows the maximum temperatures recorded for two consecutive weeks of a town. Study the graph and answer the questions that follow.

(a) What information is given by the two axes?
(b) In which week was the temperature higher on most of the days?
(c) On which day was the temperature same in both the weeks?
(d) On which day was the difference in temperatures the maximum for both the weeks?
(e) What were the temperatures for both the weeks on Thursday?
(f) On which day was the temperature 35°C for the first week?
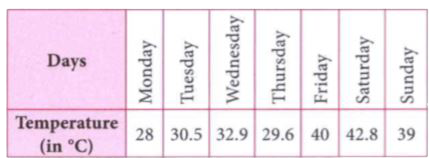
(g) On which day was the temperature highest for the second week?05:27View SolutionThe temperature (in °C) of a city in a week was recorded as follows :

What is the range of the temperature?02:10View Solution

