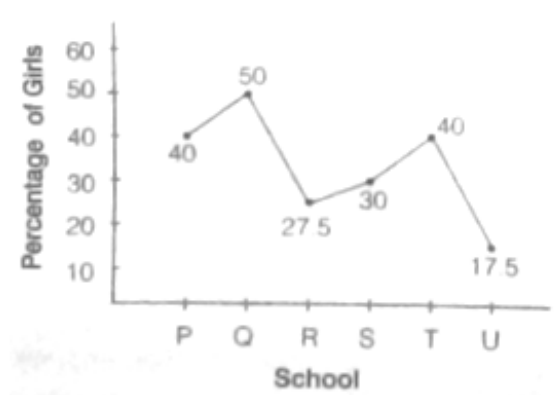
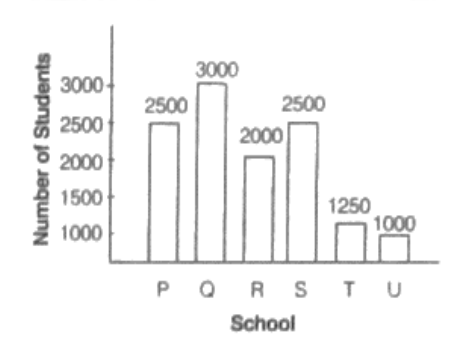
दिए गए चित्र में विभिन्न विद्यालयों में पढ़ने वाली लड़कियों का प्रतिशत दिया गया है। सावधानी से पढ़कर निम्न प्रश्नों के उत्तर दीजिए।


विद्यालयों P तथा Q में कुल मिलाकर विद्यार्थियों की औसत संख्या है
1425
1575
1450
2750
Step by step video & image solution for दिए गए चित्र में विभिन्न विद्यालयों में पढ़ने वाली लड़कियों का प्रतिशत दिया गया है। सावधानी से पढ़कर निम्न प्रश्नों के उत्तर दीजिए। विद्यालयों P तथा Q में कुल मिलाकर विद्यार्थियों की औसत संख्या है by Maths experts to help you in doubts & scoring excellent marks in Class 14 exams.
Similar Questions
The area of the shaded part in the figure given below is ______.
 02:03View Solution
The inequation represented by the graph given below is :
02:10View SolutionThe inequation that best describes the graph given below is _________
02:17View SolutionThe inequation that best describes the following graph is _________
02:10View SolutionWhich inequations represent the shaded region in the given figure
04:23View SolutionAt point P, the value of (dy)/(dx) is : ltimg src="https://d10lpgp6xz60nq.cloudfront.net/physics_images/ALN_PHY_R04_E01_025_Q01.png" width="80%"gt
01:49View SolutionMatch the followings (column I with column II)
ltimg src="https://d10lpgp6xz60nq.cloudfront.net/physics_images/NCERT_BIO_XI_C03_E01_011_Q01.png" width="80%"gt03:12View SolutionAt point P, the value of (dy)/(dx) is : ltimg src="https://d10lpgp6xz60nq.cloudfront.net/physics_images/ALN_PHY_R04_E01_025_Q01.png" width="80%"gt
01:44View Solution
