नीचे दिया गया अधुरा दण्ड आरेख 5 दिनों में एक बर्गर बेचने वाले की बिक्री (बर्गरो की संख्या) को दर्शाता है
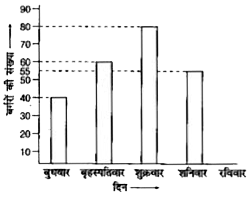
बर्गरो की कुल बिक्री 320 है | रविवार को कितने बर्गर बिके ?
85
80
75
90
The correct Answer is:A
Step by step video, text & image solution for नीचे दिया गया अधुरा दण्ड आरेख 5 दिनों में एक बर्गर बेचने वाले की बिक्री (बर्गरो की संख्या) को दर्शाता है बर्गरो की कुल बिक्री 320 है | रविवार को कितने बर्गर बिके ? by Maths experts to help you in doubts & scoring excellent marks in Class 6 exams.
Similar Questions
The inequation that best describes the graph given below is _________
02:17View SolutionThe inequation that best describes the following graph is _________
02:10View SolutionWhich inequations represent the shaded region in the given figure
04:23View SolutionThe table below shows the sales of milk in six different states as a percentage of total sales. In each state only two milkmen A and B sell the milk. The table below shows the sales of salesman A as percentage of total sale of milk in each state. The total sales of milk is 200000 litres.
नीचे दी गईं तालिका में छः विभिन्न राज्यों में दूध की कुल बिक्री को प्रतिशत में दर्शाया गया है। प्रत्येक राज्य में केवल दो दूध विक्रेता A तथा B दूध बेचते है। नीचे दी गई तालिका प्रत्येक राज्य में दूध की कुल बिक्री के प्रतिशत में विक्रेता A दवारा की गई बिक्री को दर्शाती है। दूध की कुल बिक्री 200000 लीटर है।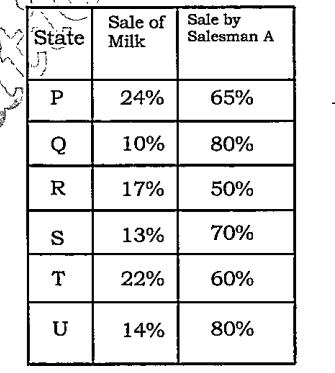 What is the difference (in litres) between the sale of milk in state R by salesmen A and the sale of milk in the same state by the salesmen B?
राज्य R में विक्रेता A द्वारा की गई दूध की बिक्री तथा समान राज्य में विक्रेता B द्वारा की गई दूध की बिक्री में क्या अंतर (लीटर मे) है?02:06View SolutionThe bar graph given below shows the number of cars parked in a parking area during ten different days. What is the total number of cars parked in the parking area for all 10 days ?
नीचे दिया गया दंड आरेख किसी पार्किंग क्षेत्र में दस अलग-अलग दिनों में खड़ी कारों की संख्या को दर्शाता है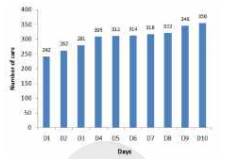 पार्किंग क्षेत्र में सभी 10 दिनों में खड़ी कारों की कुल संख्या कितनी है ?01:39View Solution
The Bar graph given below presents the number of shoes manufactured by a company on the different days of a week.
नीचे दिया गया दंड आरेख एक कंपनी के द्वारा सप्ताह के अलग-अलग दिनों को बनाए गए जूतों की संख्या प्रस्तुत करता है |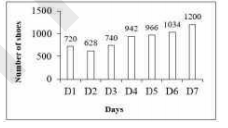 The number of shoes manufactured on D1 is what
percentage of shoes manufactured on D7?
D1 को बनाए गए जूतों की संख्या D7 को बनाए गए जूतों की संख्या का कितना प्रतिशत है ?01:48View SolutionThe Bar graph given below presents the number of shoes manufactured by a company on the different days of a week.
नीचे दिया गया दंड आरेख एक कंपनी के द्वारा सप्ताह के अलग-अलग दिनों को बनाए गए जूतों की संख्या प्रस्तुत करता है |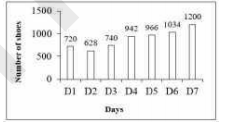 What is the total number of shoes manufactured by the company on all seven days together?
सभी सात दिनों को मिलाकर कंपनी के द्वारा बनाए गए जूतों की कुल संख्या कितनी है ?01:42View SolutionThe given Venn diagram represents employees in an organisation The triangle represents ‘teachers’, the circle represents ‘ladies’, the rectangle represents ‘unmarried persons’. The numbers given in the diagram represent the number of persons in that particular category. How many married ladies are teachers ? दिया गया वेन आरेख एक संगठन में कर्मचारियों की संख्या को दर्शाता है | त्रिभुज 'शिक्षकों' को दर्शाता है, वृत्त 'महिलाओं' को दर्शाता है, आयत “अविवाहित लोगों' को दर्शाता है | आरेख में दी गयी संख्याएँ उस विशेष श्रेणी में व्यक्तियों की संख्या को दर्शाती हैं | कितनी विवाहित महिलाएं शिक्षक हैं ?
02:02View Solution
