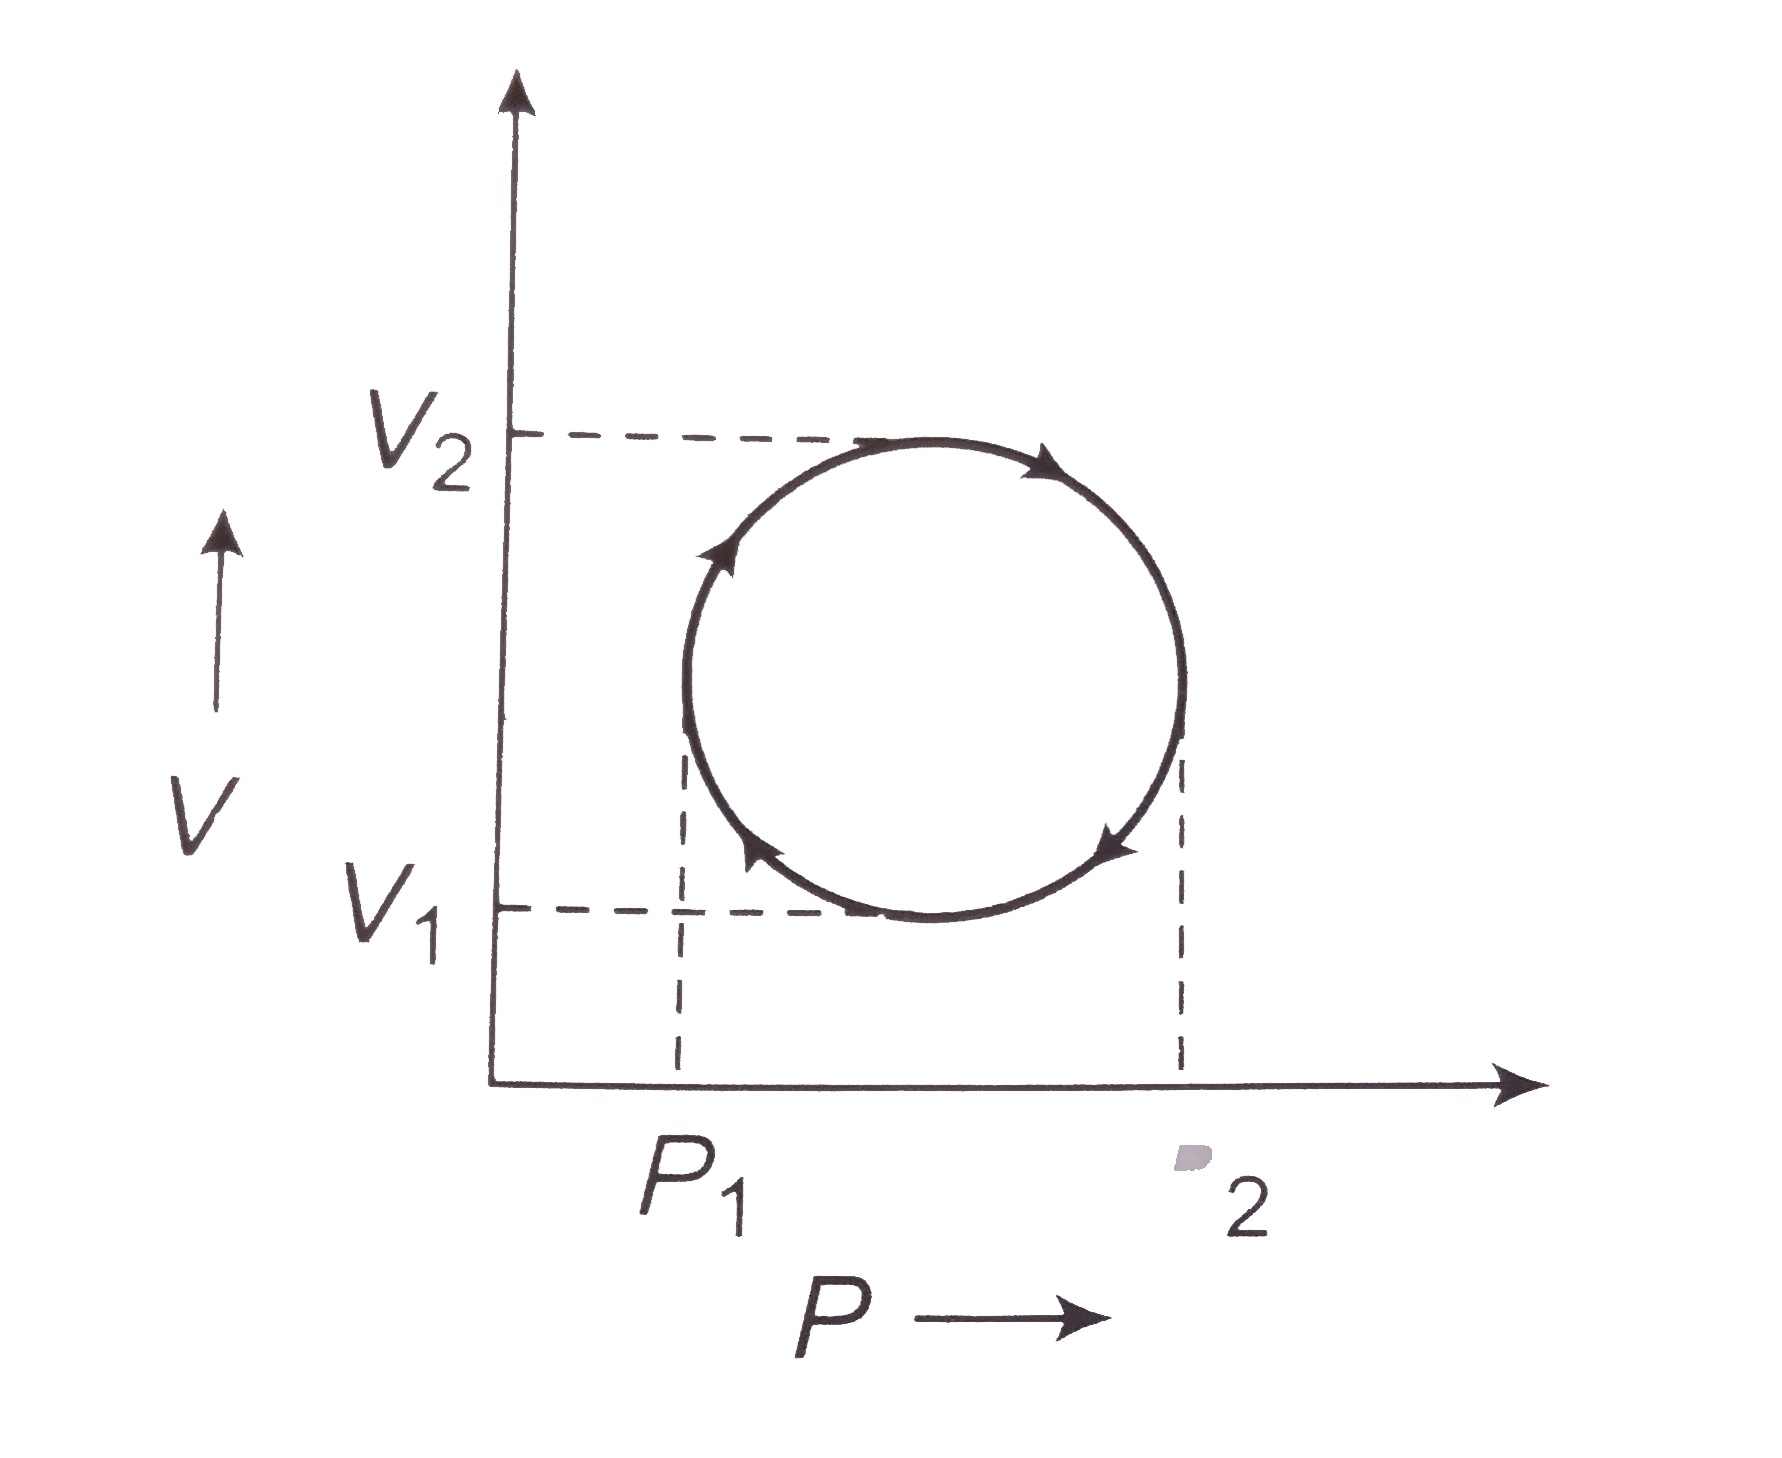
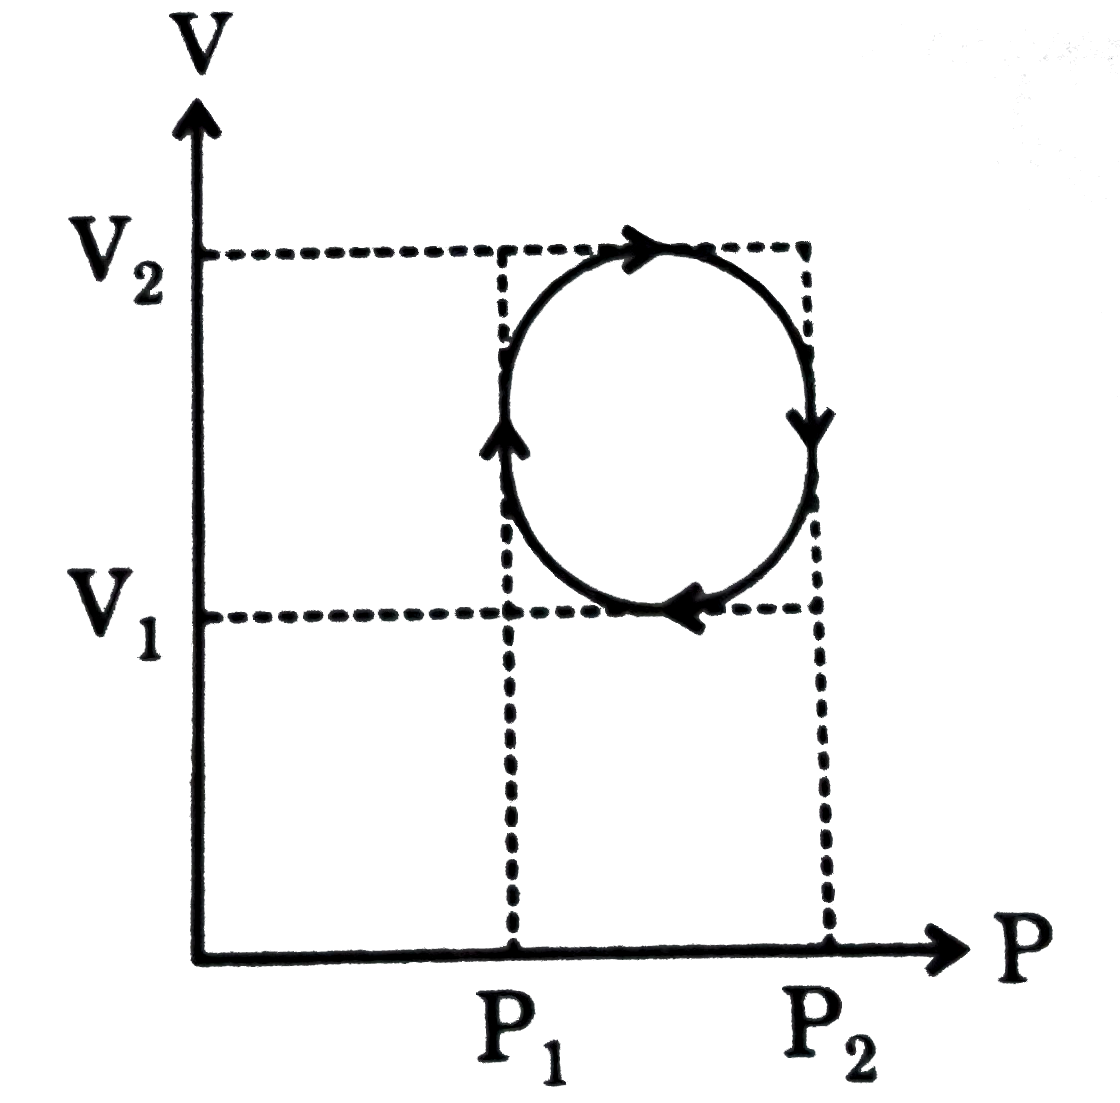
In the cyclic process shown in the V−P diagram the magnitude of the work is done is Solution in Telugu
π(P2−P12)2
π(V2−V12)2
π4(P2−P1)(V2−V1)
π(V2−V1)2
The correct Answer is:C
Process direction in V-P diagram is clockwise so process direction in P-V diagram is anti-clockwise.
Net work done by system = Area
=π×(P2−P1)2.(V2−V1)2
Topper's Solved these Questions
- THERMODYNAMICSBOOK - NARENDRA AWASTHICHAPTER - THERMODYNAMICSEXERCISE - Level 1 (Q.1 To Q.30)
6 Videos
- THERMODYNAMICSBOOK - NARENDRA AWASTHICHAPTER - THERMODYNAMICSEXERCISE - Level 1 (Q.31 To Q.60)
2 Videos
- STOICHIOMETRYBOOK - NARENDRA AWASTHICHAPTER - STOICHIOMETRYEXERCISE - Level 3 - Subjective Problems
20 Videos
Similar Questions
A system undergoes a process in which ΔU=+300J while absorbing 400 J of heat energy and undergoing an expansion against 0.5 bar. What is the change in the volume (in L)?
View SolutionA gas expands against a variable pressure given by P=20V (where P in atm and V in L). During expansion from volume of 1 litre to 10 litre, the gas undergoes a change in internal energy of 400 J. How much heat is absorbed by the gas during expansion?
View SolutionWhat volume of a liquid (in L) will contain 10 mole ? If molar mass of liquid is 280 and its density is 1.4 g/mL.
View SolutionIn the cyclic process shown on PV diagram, the magnitude of the work done is
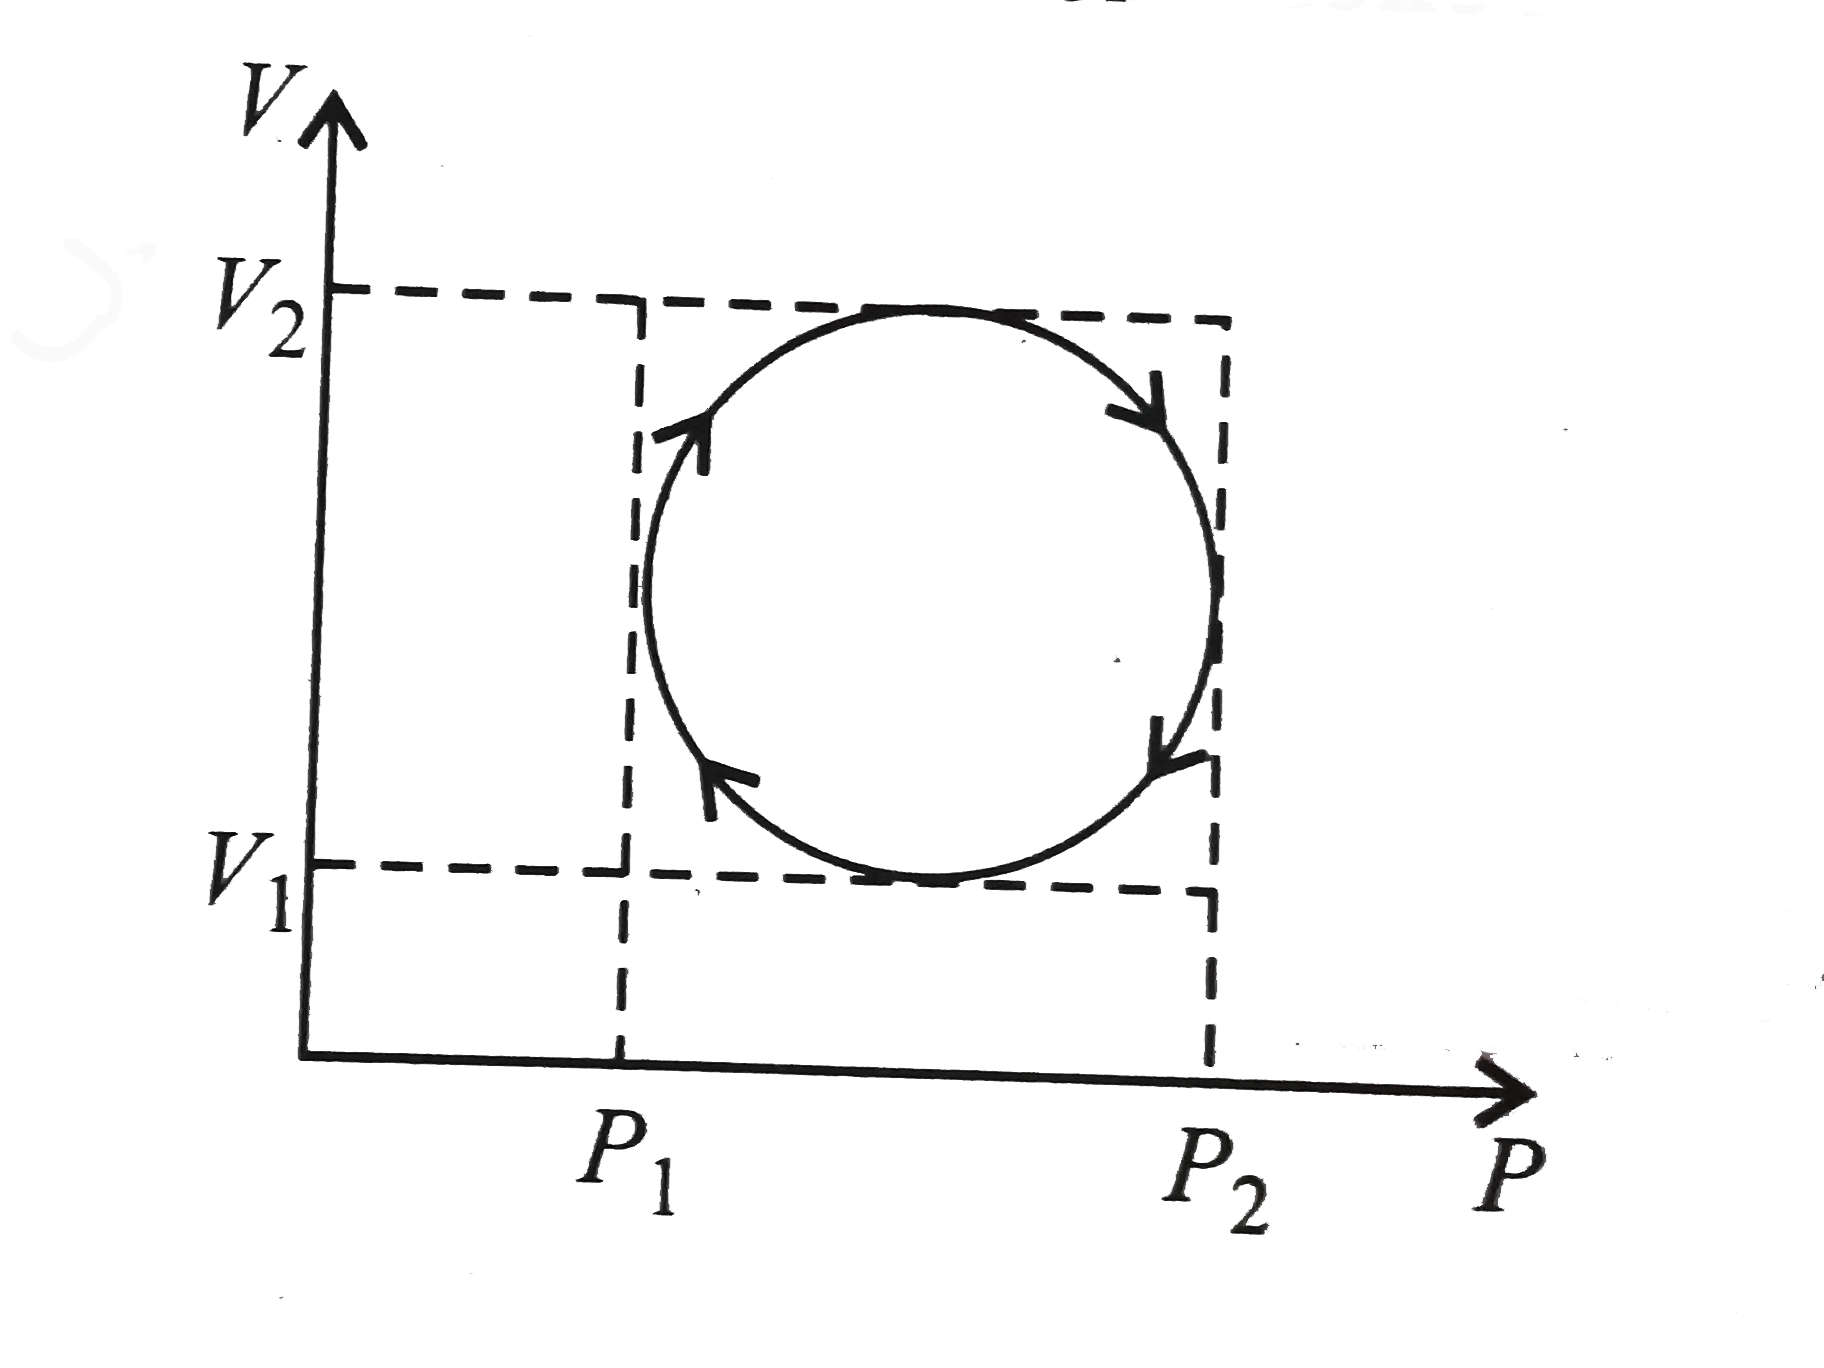
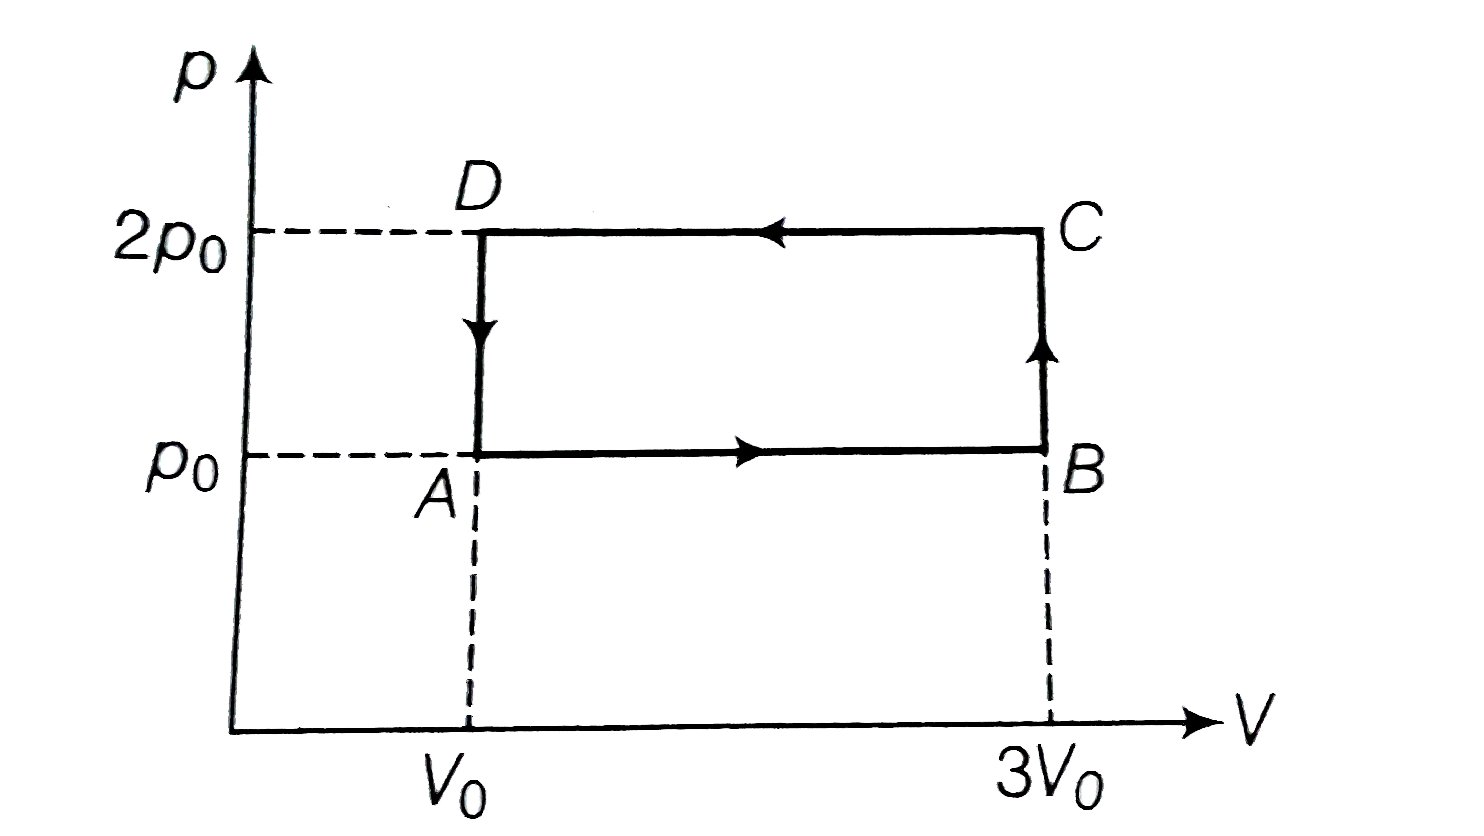
View SolutionAn ideal gas underoges cyclic process of ABCDA as shown in Given P−V diagram (figure)
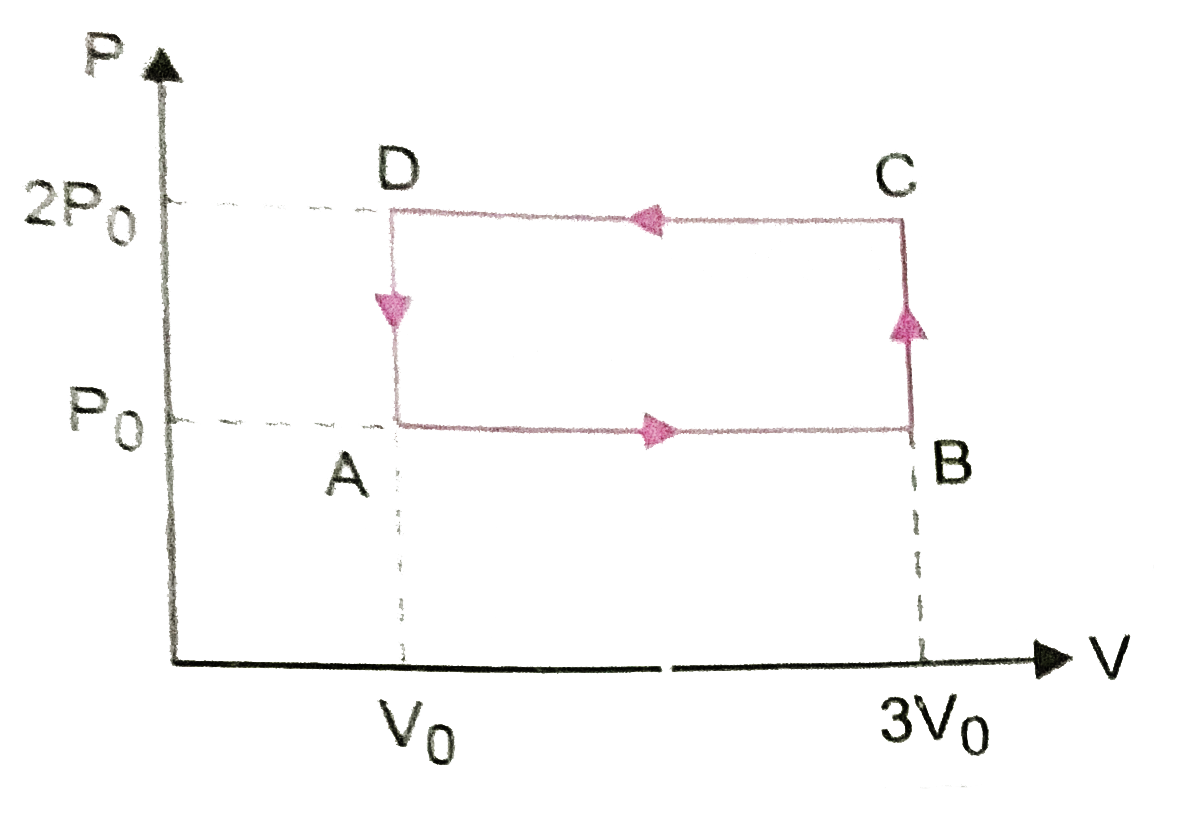
The amount of work done by the gas is
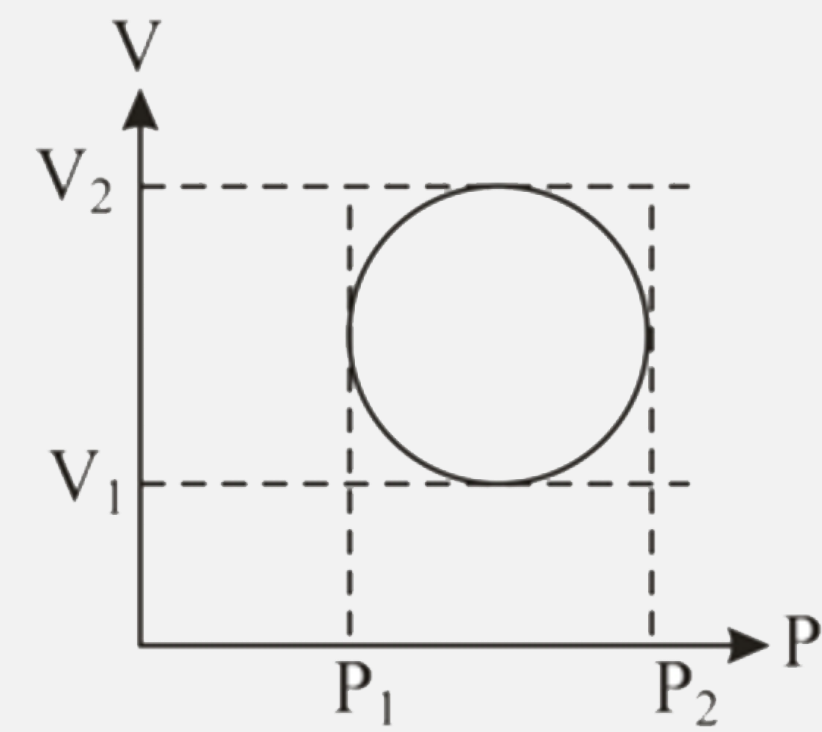
View SolutionIn the cyclic process shown in the V-P diagram the magnitude of the work is done is
View SolutionIn a cyclic process shown on the P−V diargam the magnitude of the work done is :

View SolutionThe P-V diagram of a gas system undergoing cyclic process is shown here. The work done during isobaric compression is
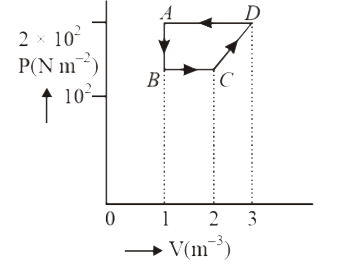
View SolutionWork done in the given P - V diagram in the cyclic process is
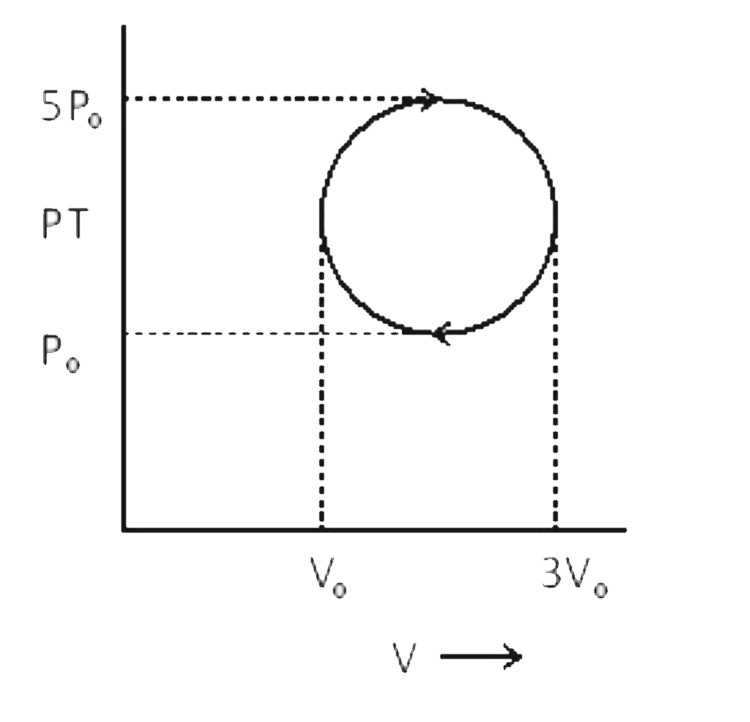
View SolutionIn the cyclic process shown in P-V diagram the magnitude of work done is :
View SolutionAn ideal gas undergoes cyclic process ABCDA as shown in givend p−V diagram. The amount of work done by the gas is
View SolutionP – V graph for a cyclic process is shown in figure . Work done is given by
View SolutionIn the cyclic process shown in P - V diagram, the magnitude of the work done is
View SolutionAn ideal gas undergoes cyclic process ABCDA as shown in given P - V diagram. The amount of work done by the gas is ___
View Solution
In the cyclic process shown in the V−P diagram the magnitude of the work is done is
View Solutionदिए गए P- V आरेख पर प्रदर्शित चक्रीय प्रक्रम में किए गए कार्य का परिमाण होगा

View Solution
