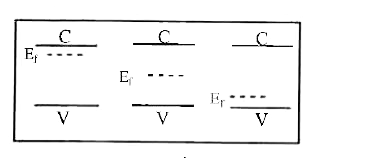
The band diagrams of three semiconductors are given in the figure. From left to right they are respectively.

n-intrinsic-p
p-intrinsic-n
intrinsic-p-n
intrinsic-n-p
Step by step video solution for The band diagrams of three semiconductors are given in the figure. From left to right they are respectively. by Physics experts to help you in doubts & scoring excellent marks in Class 12 exams.
Updated on:21/07/2023Topper's Solved these Questions
- SEMICONDUCTOR DEVICESBOOK - AAKASH SERIESCHAPTER - SEMICONDUCTOR DEVICESEXERCISE - EXERCISE - IB
7 Videos
- SEMICONDUCTOR DEVICESBOOK - AAKASH SERIESCHAPTER - SEMICONDUCTOR DEVICESEXERCISE - EXERCISE - II
17 Videos
- SEMICONDUCTOR DEVICESBOOK - AAKASH SERIESCHAPTER - SEMICONDUCTOR DEVICESEXERCISE - PROBLEMS
41 Videos
- RAY OPTICSBOOK - AAKASH SERIESCHAPTER - RAY OPTICSEXERCISE - PROBLEMS ( LEVEL-II)
60 Videos
- UNITS AND MEASUREMENTBOOK - AAKASH SERIESCHAPTER - UNITS AND MEASUREMENTEXERCISE - PRACTICE EXERCISE
45 Videos
Similar Questions
Draw energy band diagram of conductors, semiconductors and insulators.
View SolutionHow valency of elements changes : Along the period from left to right
View SolutionThe effective nuclear charge across the period (from left to right)
View SolutionThe effective nuclear charge across the period (from left to right)
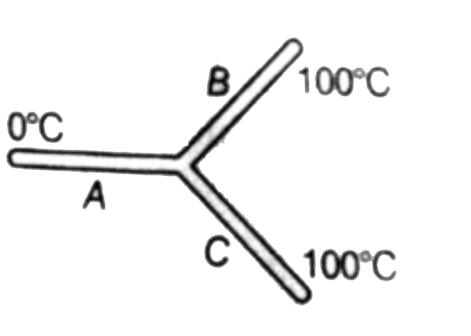
View SolutionThree rods are made from the same material and having the same cross-sectional area and length have been joined as shown in the figure.

The left end and right end are kept 0∘Cand100∘C , respectively . The temperature of the junction of three rods will be
View SolutionThe number of lobes in the right and left lung of man respectively are
View SolutionThe elements of one short period of the Periodic Table are given below in the order from left to right:
Li Be B C O F Ne
Place the three elements fluorine, beryllium and nitrogen in the order of increasing electronegativity.
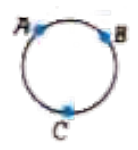
View SolutionName three minor arcs and three major arcs in the given figure.

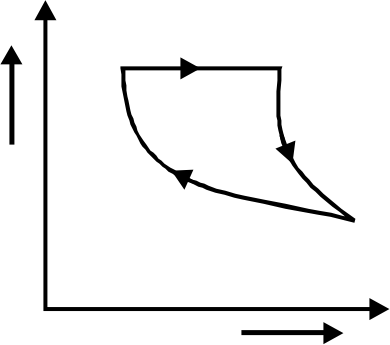
View SolutionFor a given thermodynamic cyclic process, P−V indicator diagram is as shown in the figure. Process AB,BC&CA are isobaric, & isothermal respectively. Then which of the following curve represent correc V−T indicator diagram for the process ABCA?

View SolutionWhat happens to the oxidation state of the elements of the second moving from left to right with respect to their oxides ?
View Solution
