The velocity-time graph of a particle moving along a straight line is shown in figure. The rate of acceleration and 5ms−2 . The The average velocity during the motion is 20ms−1
The maximum velocity of the particle is :
(##VMC_PHY_XI_WOR_BOK_01_C02_E03_02_Q01.png" width="80%">
5 s
10 s
20s
5√2s
The correct Answer is:A
Step by step video solution for The velocity-time graph of a particle moving along a straight line is shown in figure. The rate of acceleration and 5 ms ^(-2) . The The average velocity during the motion is 20 ms^(-1) The maximum velocity of the particle is : (##VMC_PHY_XI_WOR_BOK_01_C02_E03_02_Q01.png" width="80%"> by Physics experts to help you in doubts & scoring excellent marks in Class 11 exams.
Updated on:21/07/2023Similar Questions

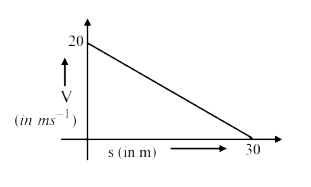
The velocity displacement graph of a particle moving along a straight line is shown in figure.
Then the acceleration displacement graph is.
View SolutionThe velocity-time graph of a particle moving along a straight line is shown is Fig. The rate of acceleration and deceleration is constant and it is equal to 5ms−2. If the a average velocity during the motion is 20ms−1, Then
 .
.
The maximum velocity of the particle is .
View SolutionThe velocity-time graph of a particle moving along a straight line is shown is Fig. The rate of acceleration and deceleration is constant and it is equal to 5ms−2. If the a average velocity during the motion is 20ms−1, Then
 .
.
The maximum velocity of the particle is .
View SolutionThe velocity-time graph of a particle moving along a straight line is shown is . The rate of acceleration and deceleration is constant and it is equal to 5ms−2. If the a average velocity during the motion is 20ms−1, Then
 .
.
The value of t is.
View SolutionThe velocity –position graph of a particle moving along a straight line is shown. Then acceleration of the particle at s = 15 m is :

View Solution
The velcocity displacement graph of a particle moving along a straight line is shown in figure. The velocity as function of x(0≤x≤1) is
View SolutionVelocity versus displacement graph of a particle moving in a straight line as shown in figure.

The acceleration of the particle.
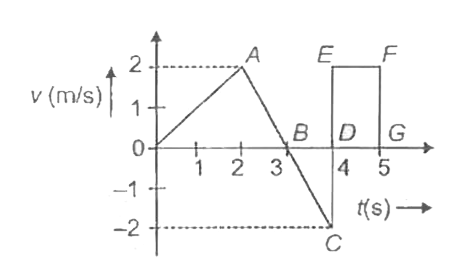
View SolutionThe velocity - time graph of a particle moving along a straight line is shown in the figure given below
The displacement of the particle in 5 second is

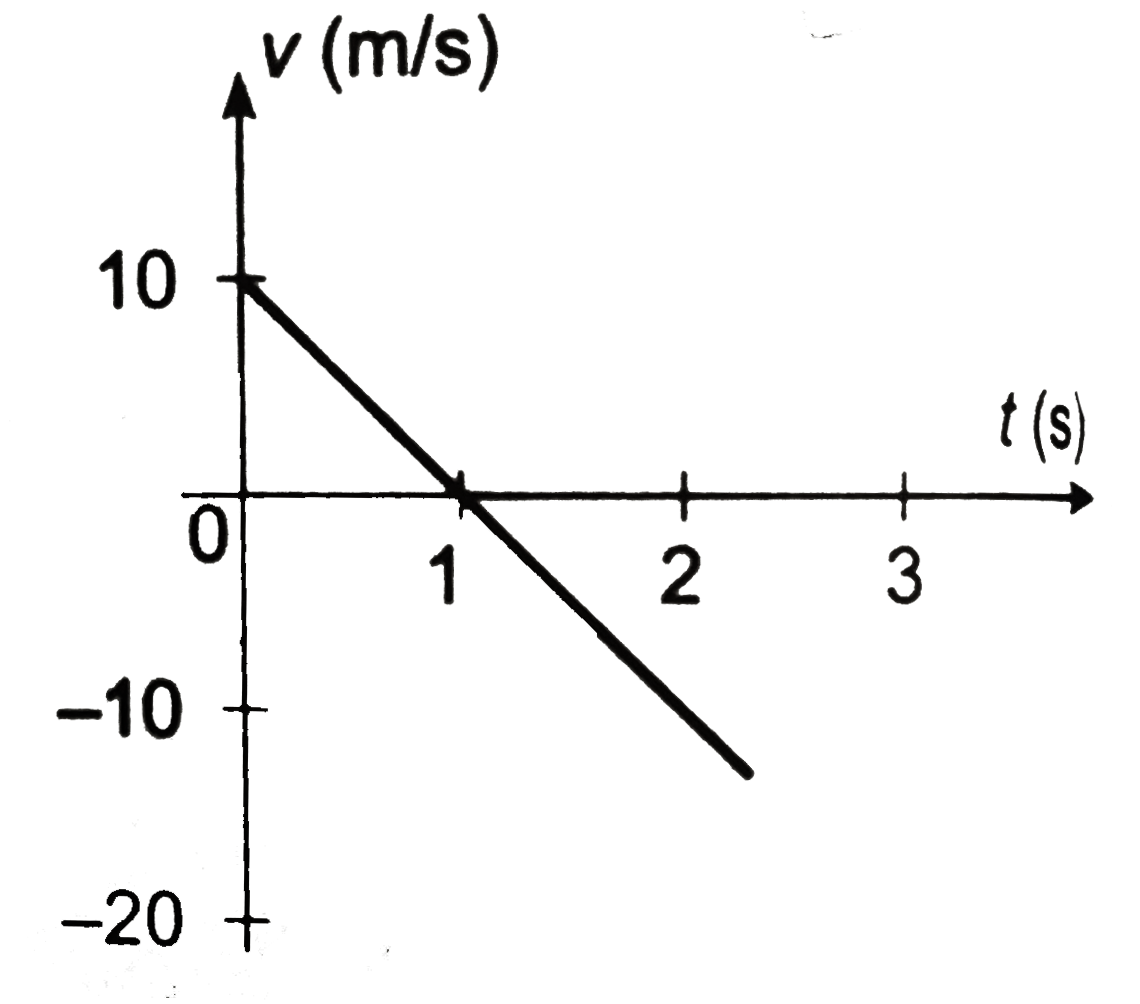
View SolutionThe figure shows velocity-time graph of a particle moving along a straight line. Identify the correct statement.

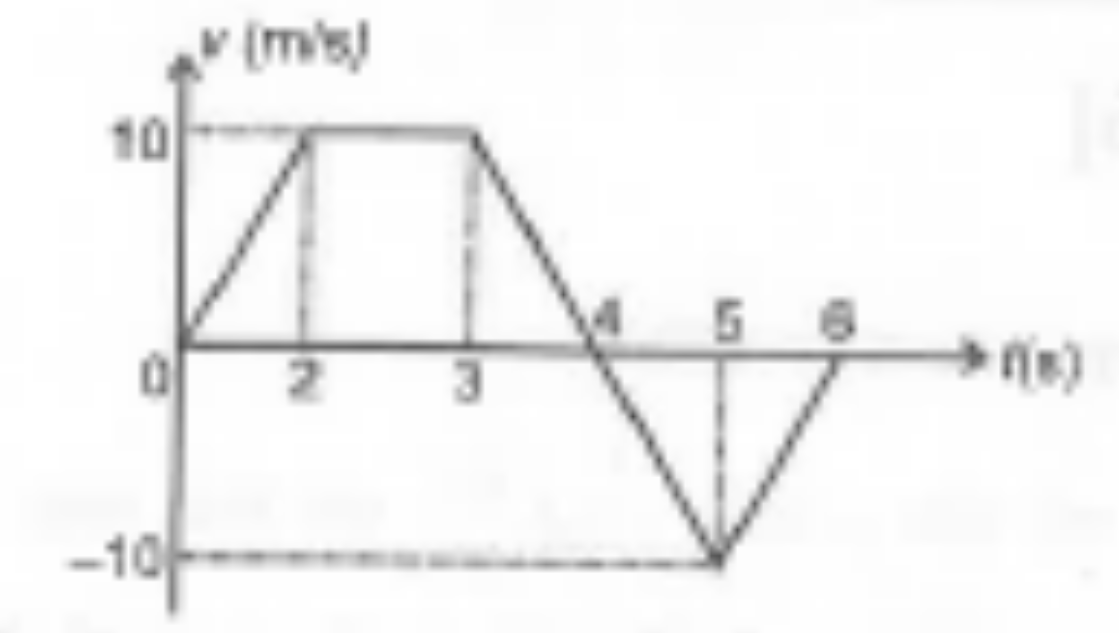
View SolutionThe velocity (v)-time (t) graph of a partide moving along a straight line is as shown in the figure. The displacement of the particle from t = 0 to t = 4 is

View Solution
