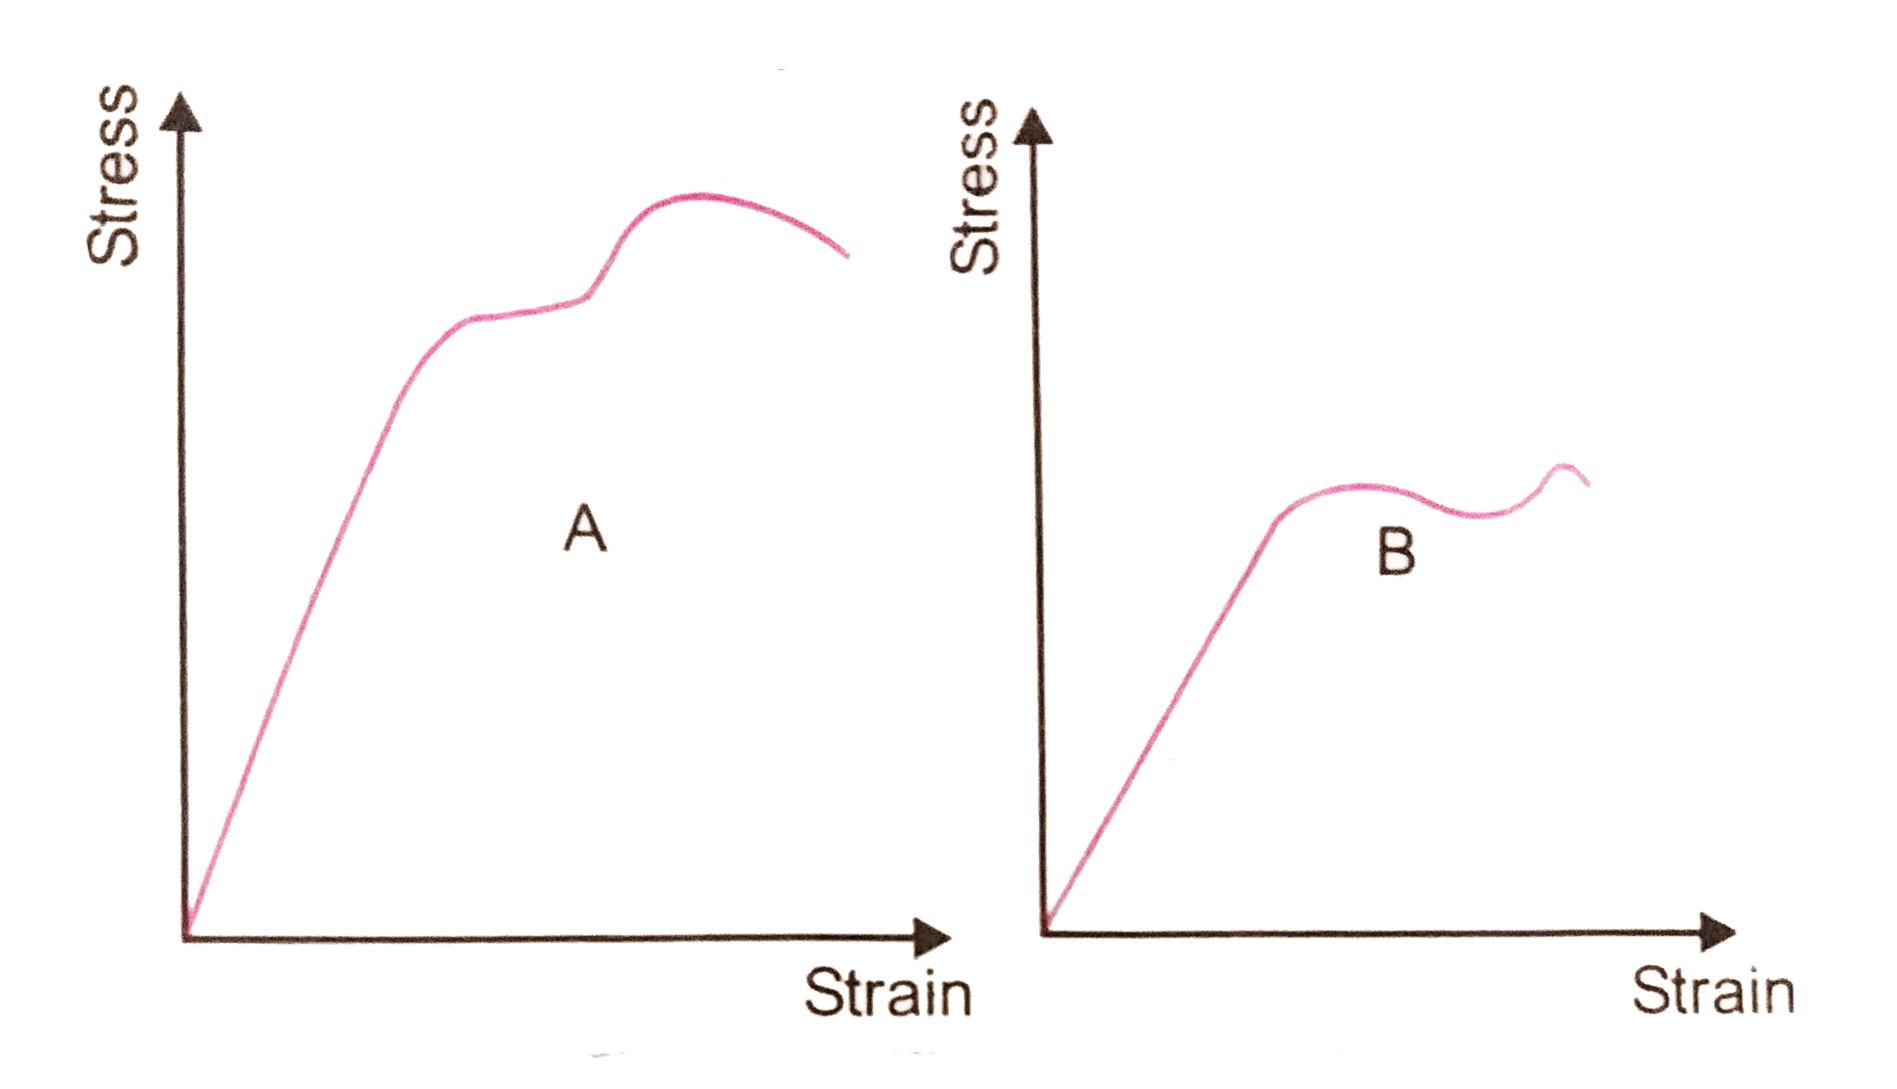
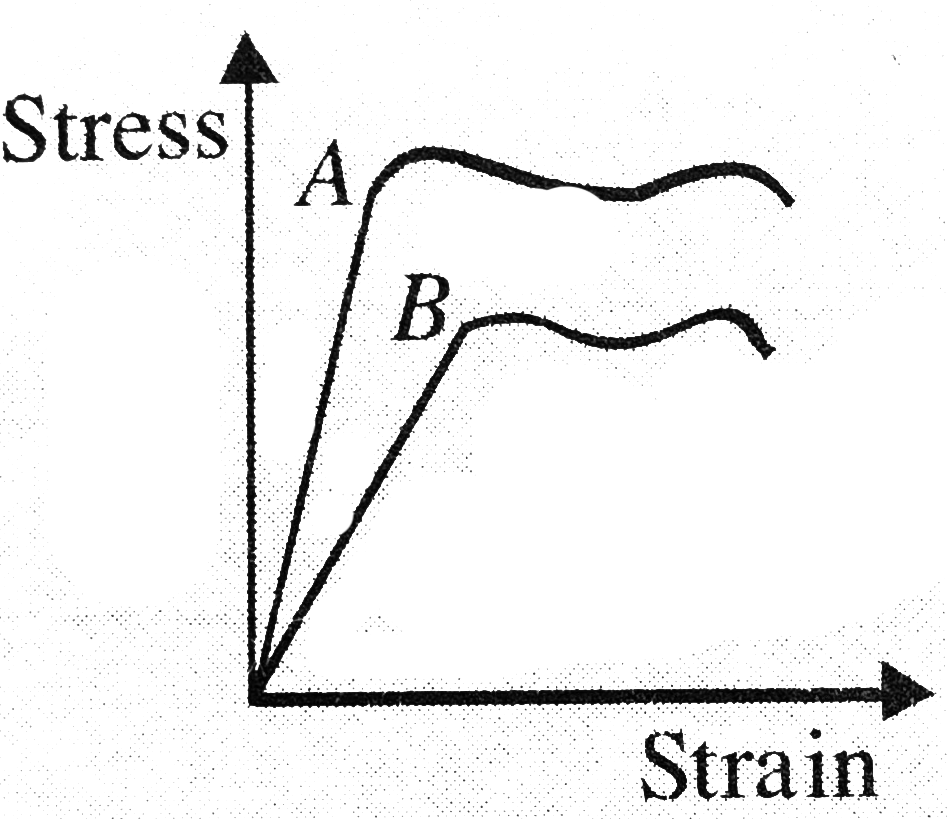
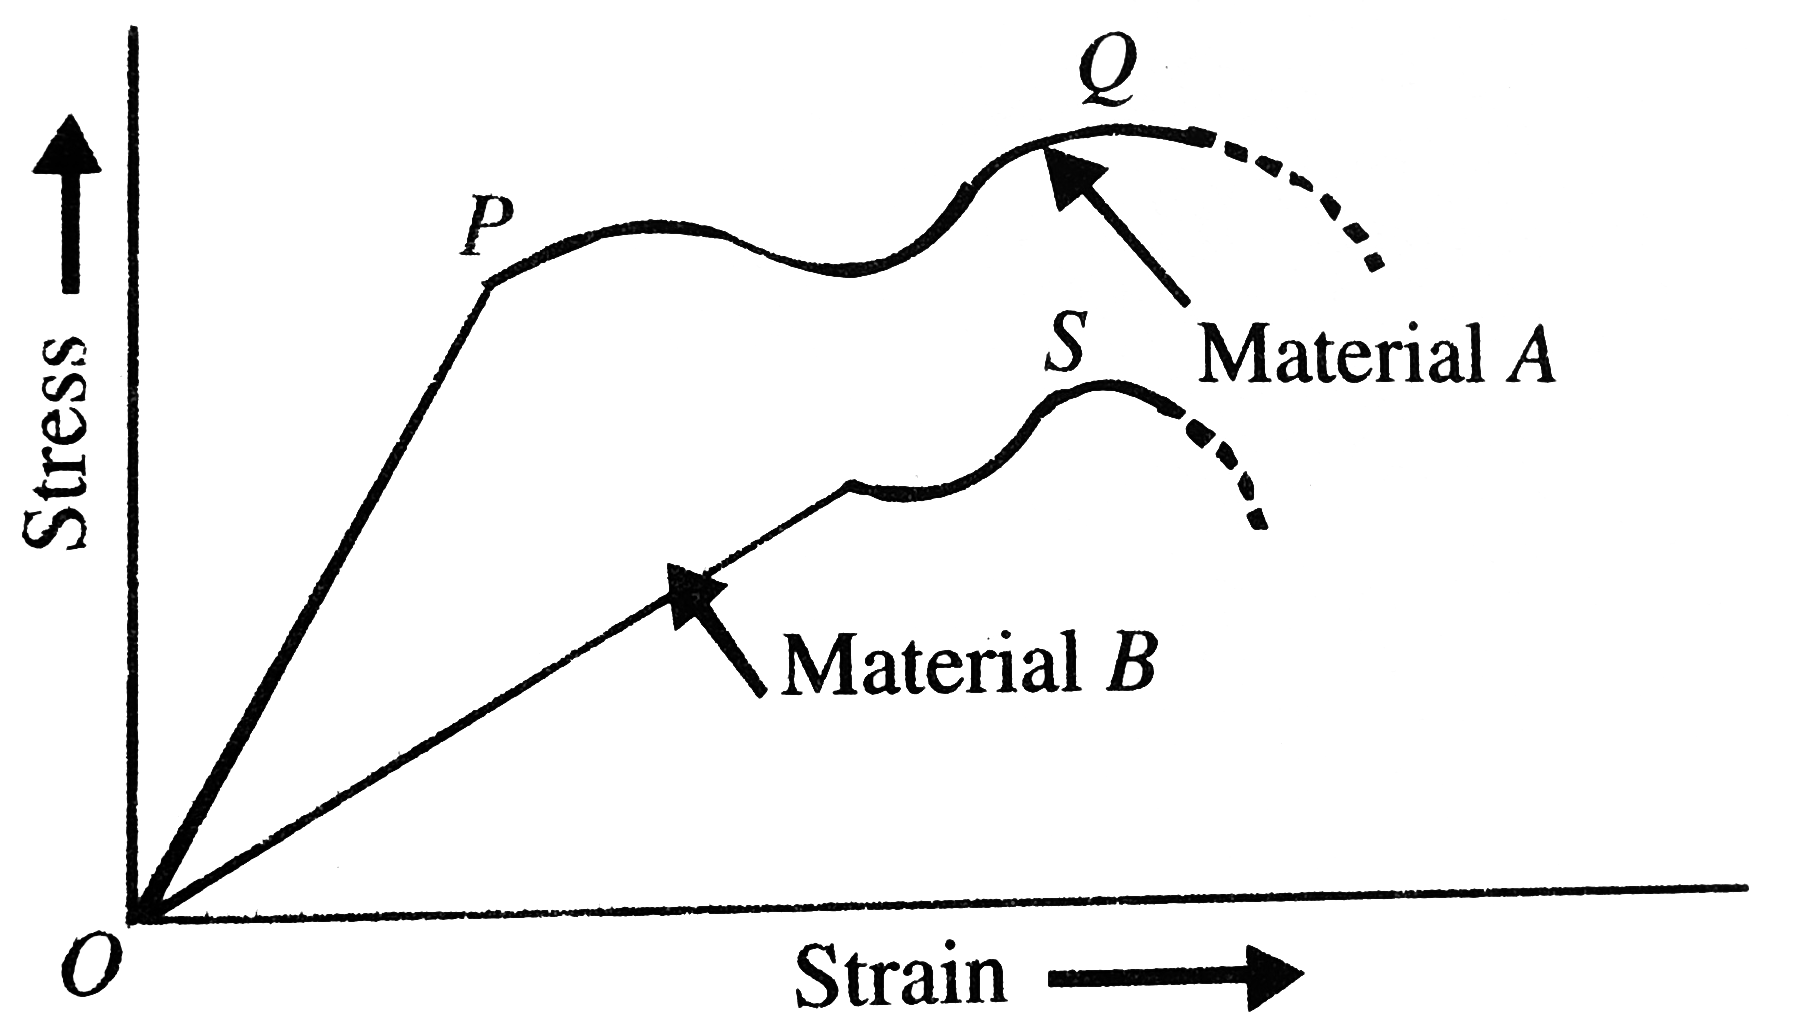
The stress-strain graphs for materials and are shown in Fig. 9.12.

The graphs are drawn to the same scale.
(a) Which of the materials has the greater Young's modulus?
(b) Which of the two is the stronger material?
(i) Young.s modulus = stress /strain = slope of the straight portion of the stress- strain graph. Since slope of slope of . Y is more for material- A than that of material B.
(ii) Strength of a material is determined by the highest point on the stress- strain curve. The stress corresponding to this point is called the ultimate strength . Since this point (C ) for material- A is higher than corresponding point for material- B, . Hence, material- A is stronger than material- B.
Similar Questions
The stress versus strain graph for two materials A and B are shown in fig. the graph are on the same scale. ltbr> (a) Which material has greater Young's modulus?
(b) which of the two is stronger material?
View SolutionThe stress-strain graphs for two materials A and B are shown in the figure. The graphs are drawn to the same scale.
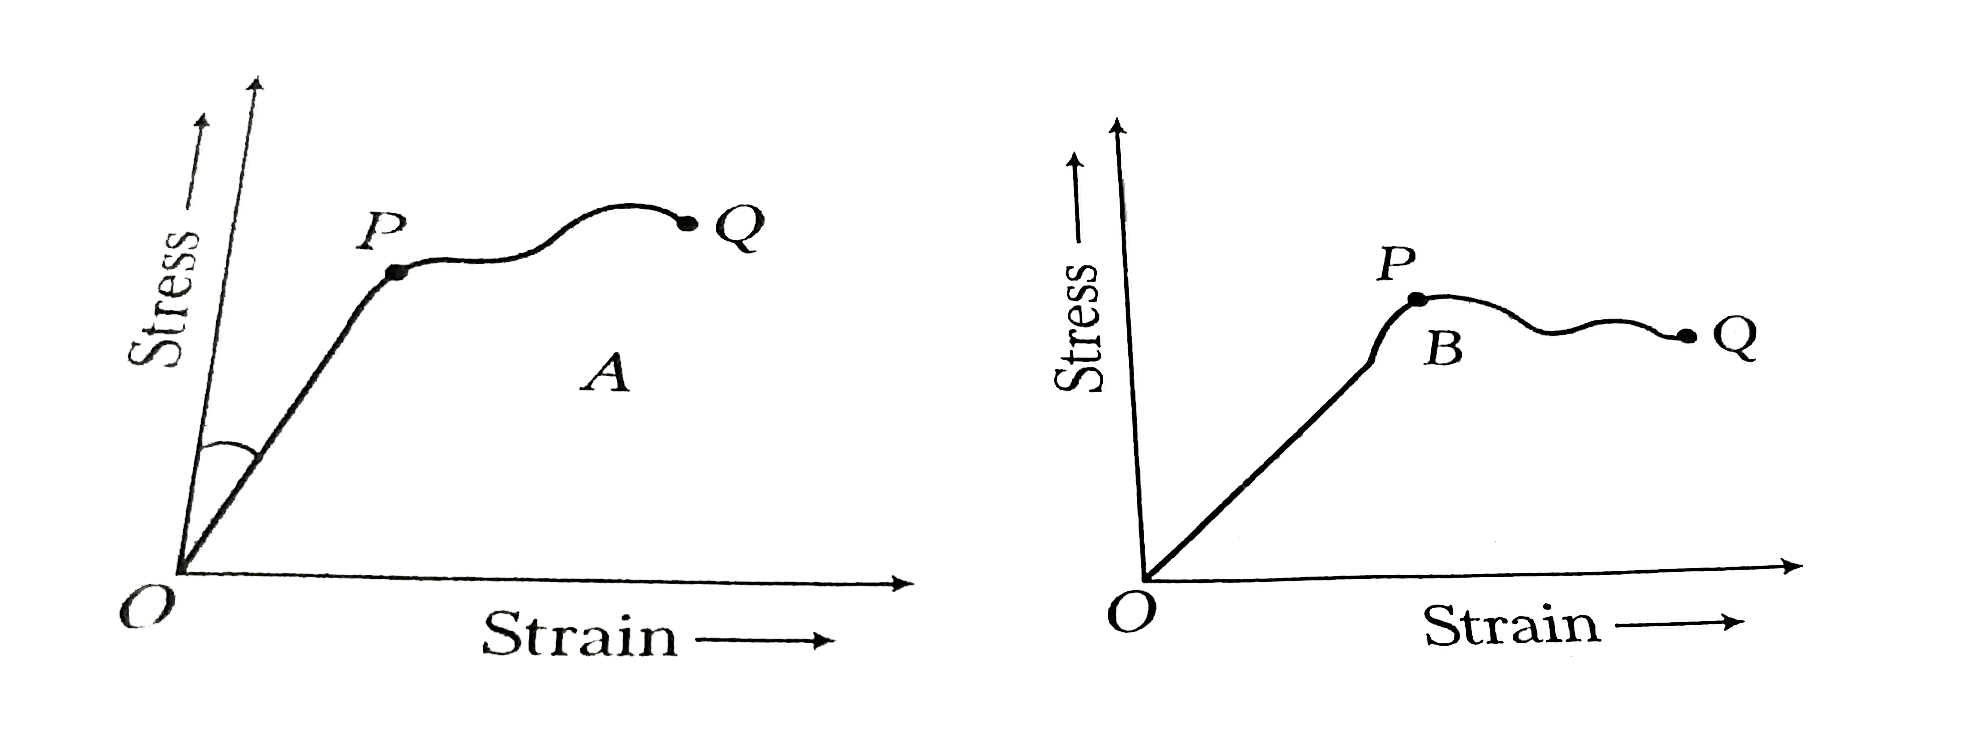
(a) Which material has a greater Young's modulus ?
(b) Which material is more ductile ?
(c) Which material is more brittle?
(d) Which of the two is the stronger material ?
View SolutionThe stress-strain graphs for two materials A and are shown in figure. The graphs are drawn to the same scale. Select the correct statement
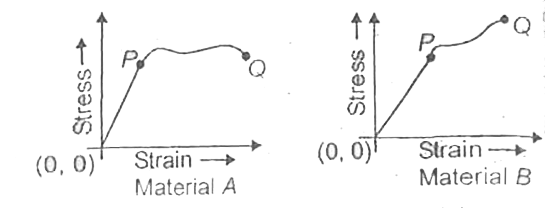
View SolutionThe stress versus strain graphs for two materials A and B are shown in Figure. ( The graphs are drawn to the same scale) (a) Which material has greater Young's modulus ? (b) Which material is more ductile ? ( c) Which is more brittle ? ( d) Which of the two is the strong material?
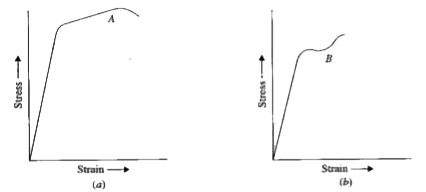
View SolutionThe stress-strain graphs for two materials are shown in Fig. 7(EP).3 (assume scale).
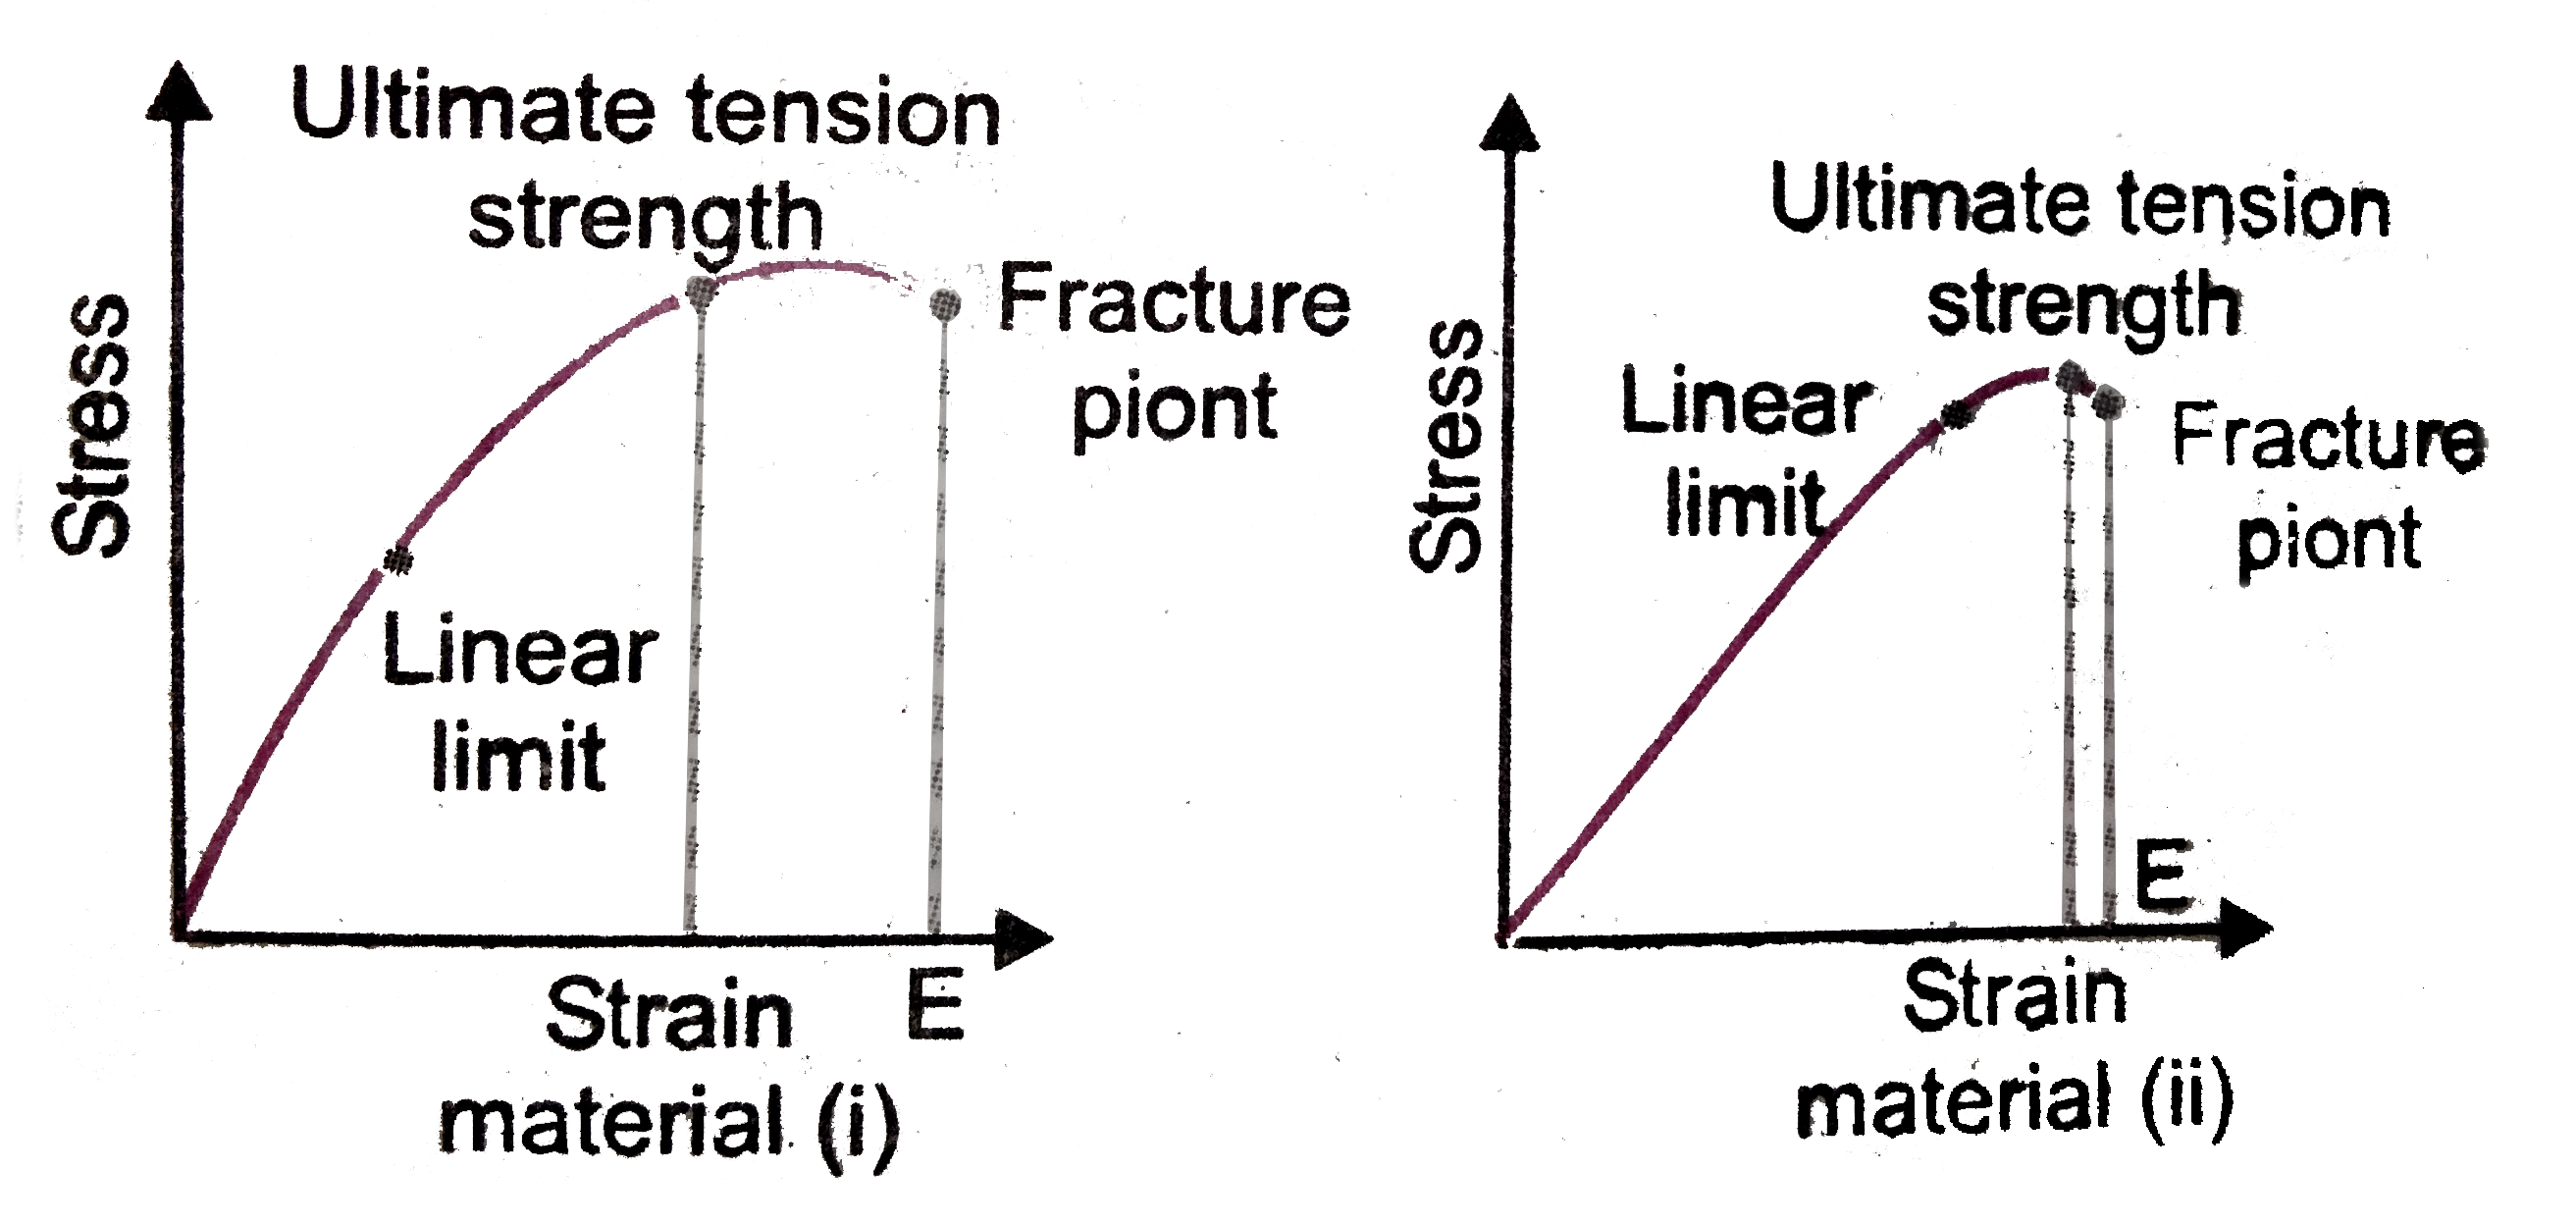
View SolutionThe stress- strain graphs for materials A and B are as shown. Choose the correct alternative
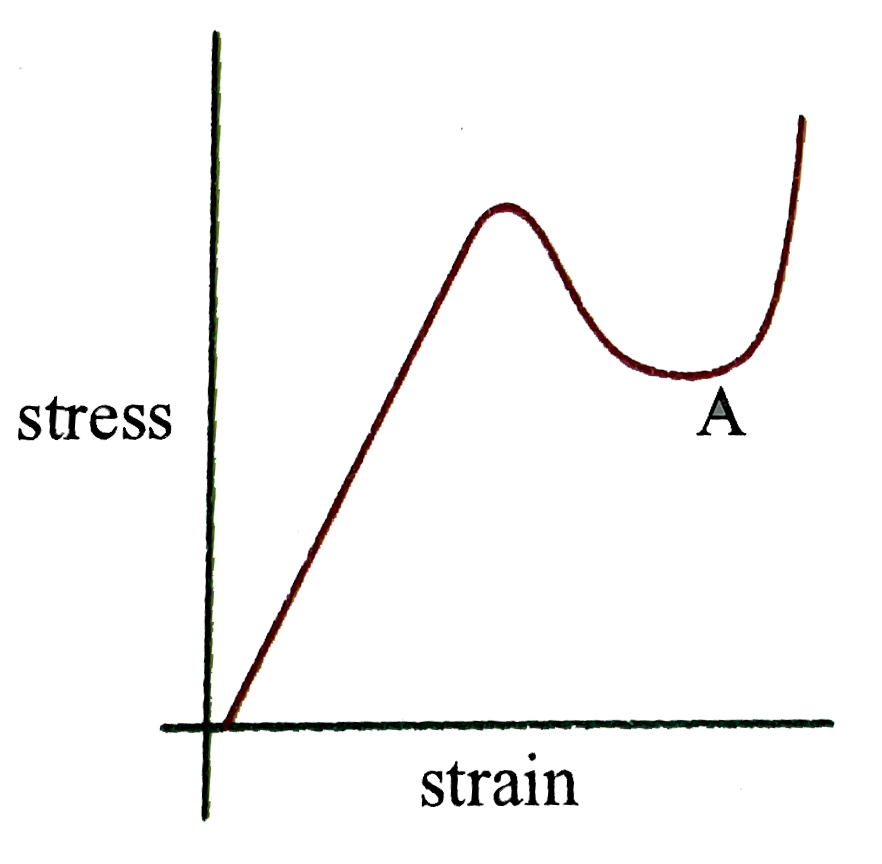
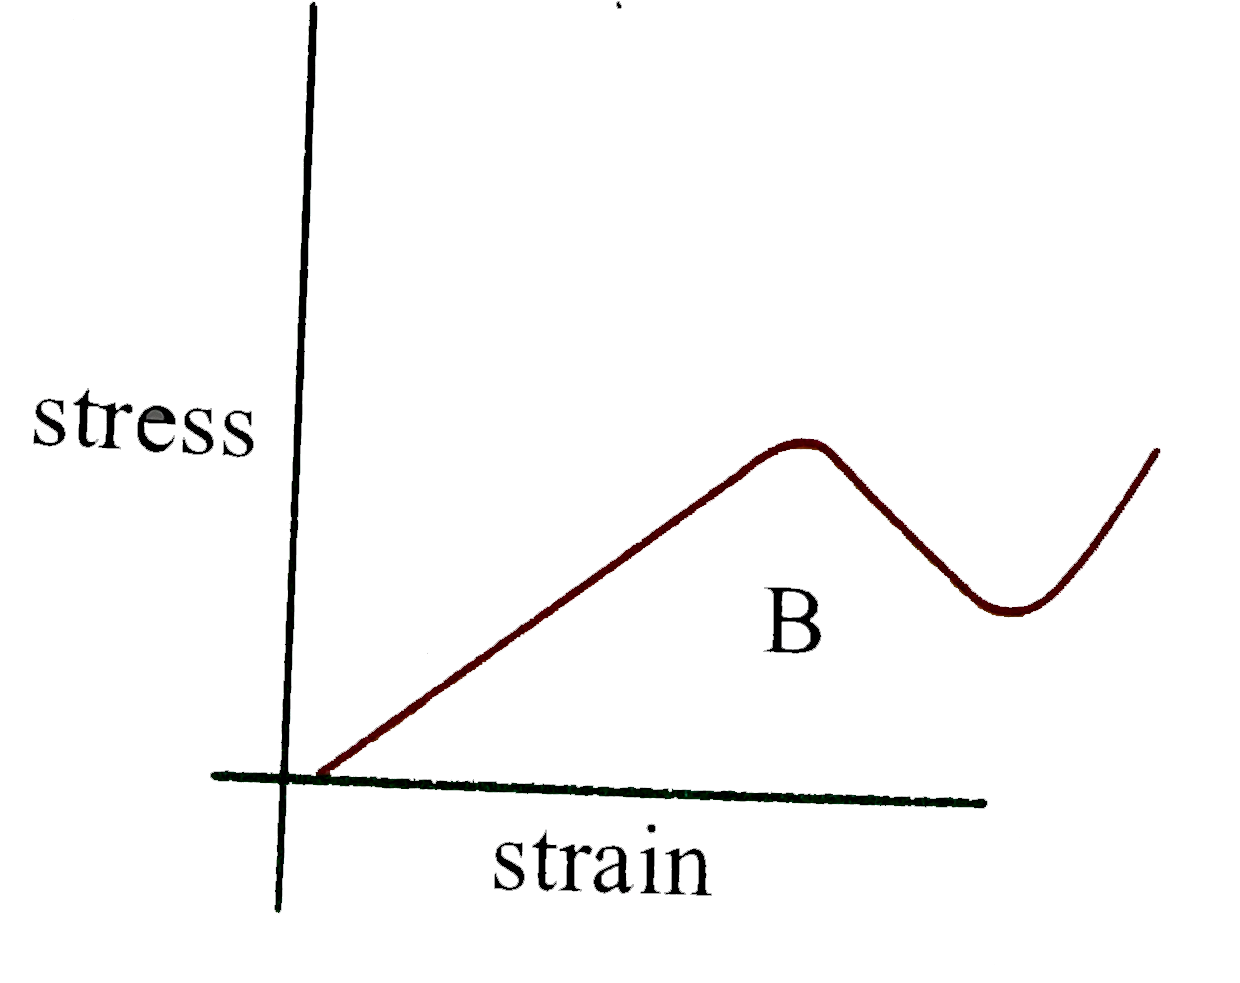
View SolutionThe stress and strain graphs for two materials, A and B are shown here. Answer the following :give reasons
View SolutionFigure shows the stress-strain graphs for materials .A and B. From the graph it follows that
View SolutionFigure shows the stress-strain graphs for materials .A and B. From the graph it follows that

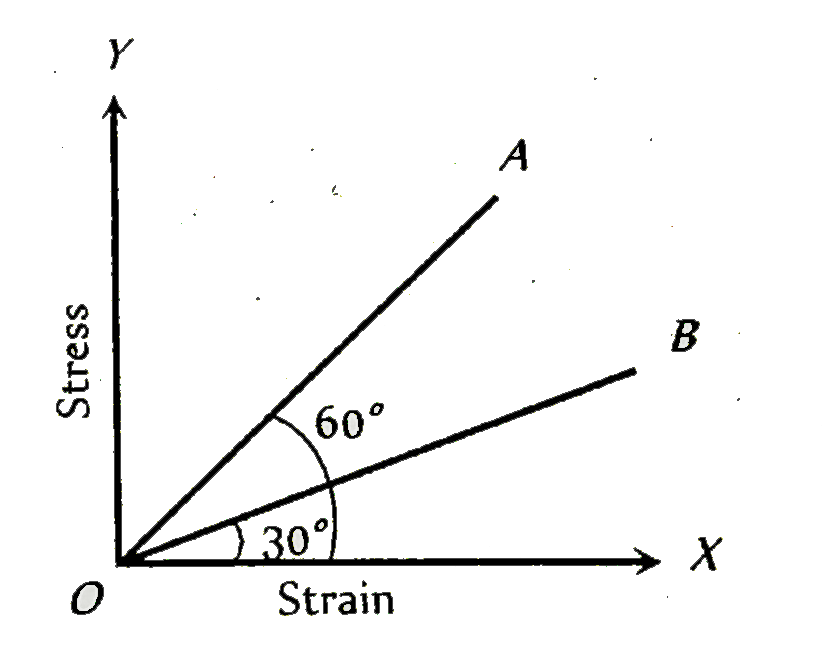
View SolutionThe stress versus strain graphs for wires of two materials A and B are as shown in the figure. If YAandYB are the younng's moduli of the materials, then
View Solution