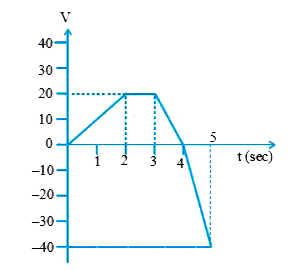
For the velocity - time graph shown in figure below the distance covered by the body in last two seconds of its motion is what fraction of the total distance covered by it in all the total distance covered by it in all the seven seconds
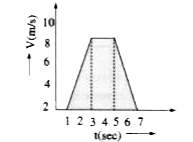
12
14
13
23
The correct Answer is:B
Step by step video solution for For the velocity - time graph shown in figure below the distance covered by the body in last two seconds of its motion is what fraction of the total distance covered by it in all the total distance covered by it in all the seven seconds by Physics experts to help you in doubts & scoring excellent marks in Class 11 exams.
Similar Questions
Knowledge Check
- Question 1 - Select One
A body starts from rest and moves with a uniform acceleration. The ratio of the distance covered in the nth sec to the distance covered in n sec is
A2n−1n2B1n2−1nC2n2−1n2D2n+1n2
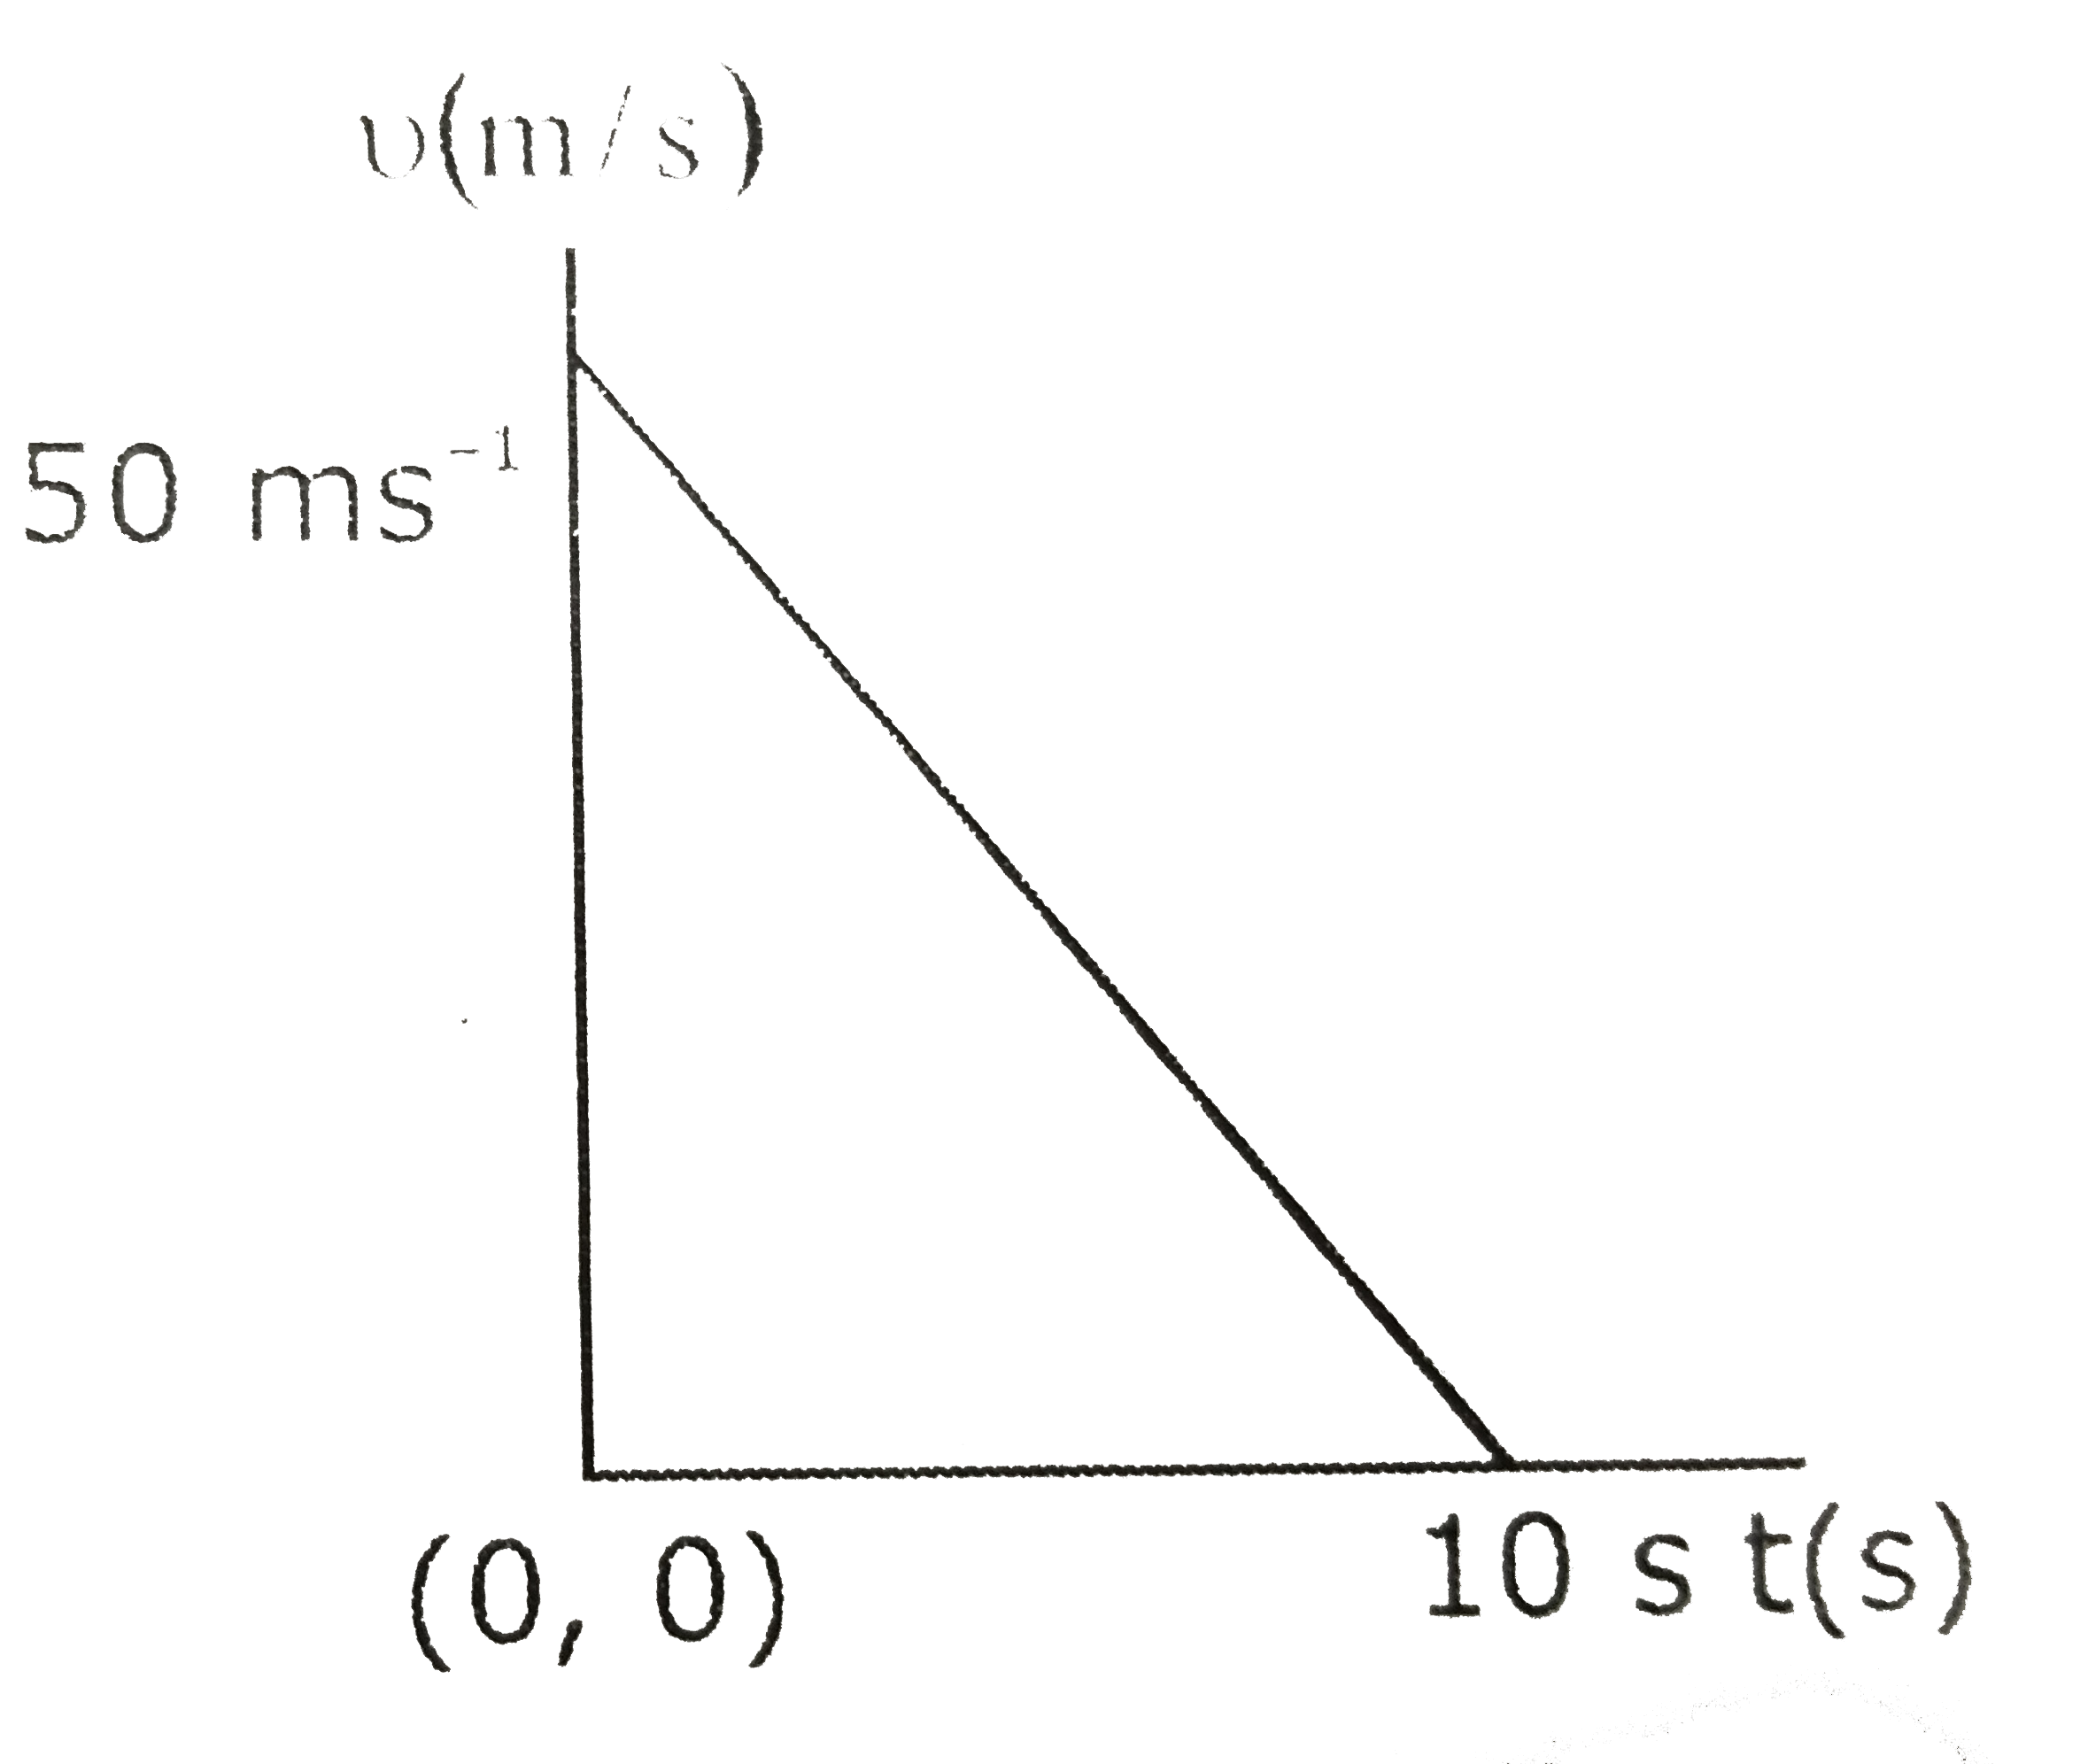
Velocity -time graph for a body of mass 10 kg is shown in figure. Work -done on the body in first two seconds of the motion is :
 View Solution
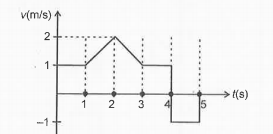
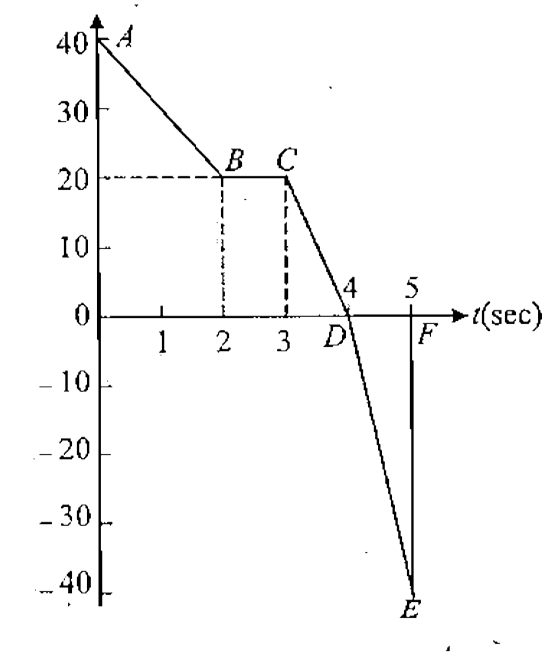
In the following velocity-time graph of a body, the distance and displacement travelled by the body in 5 seconds in meters will be:
 View Solution
A stone falls freely from rest and the total distance covered by it in last second of its motion equals the distance covered by it in the first 3s of its motion. How long the stone will remain in the air?
View SolutionA stone falls freely rest. The distance covered by it in the last second is equal to the distance covered by it in the first 2 s. The time taken by the stone to reach the ground is
View SolutionFor a stone what is the ratio of the distance covered in its 1st, 3rd and 5th seconds of its free fall.
View SolutionIn the following velocity time graph of a body the distance travelled by the body and its displacement during 5 second in meter will be:
 View Solution
If the distance travelled by a freely falling body in the last second of its journey is equal to the distance travelled in the first 2s, the time of descent of the body is
View Solution

