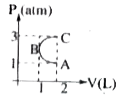
In the P-V diagram shown in figure ABC is a semicircle. The work done in the process A→B→C
0
π2 atm - L
−π2atm - L
4 atm - L
The correct Answer is:B
Step by step video & image solution for In the P-V diagram shown in figure ABC is a semicircle. The work done in the process A to B to C by Physics experts to help you in doubts & scoring excellent marks in Class 11 exams.
Updated on:21/07/2023Similar Questions
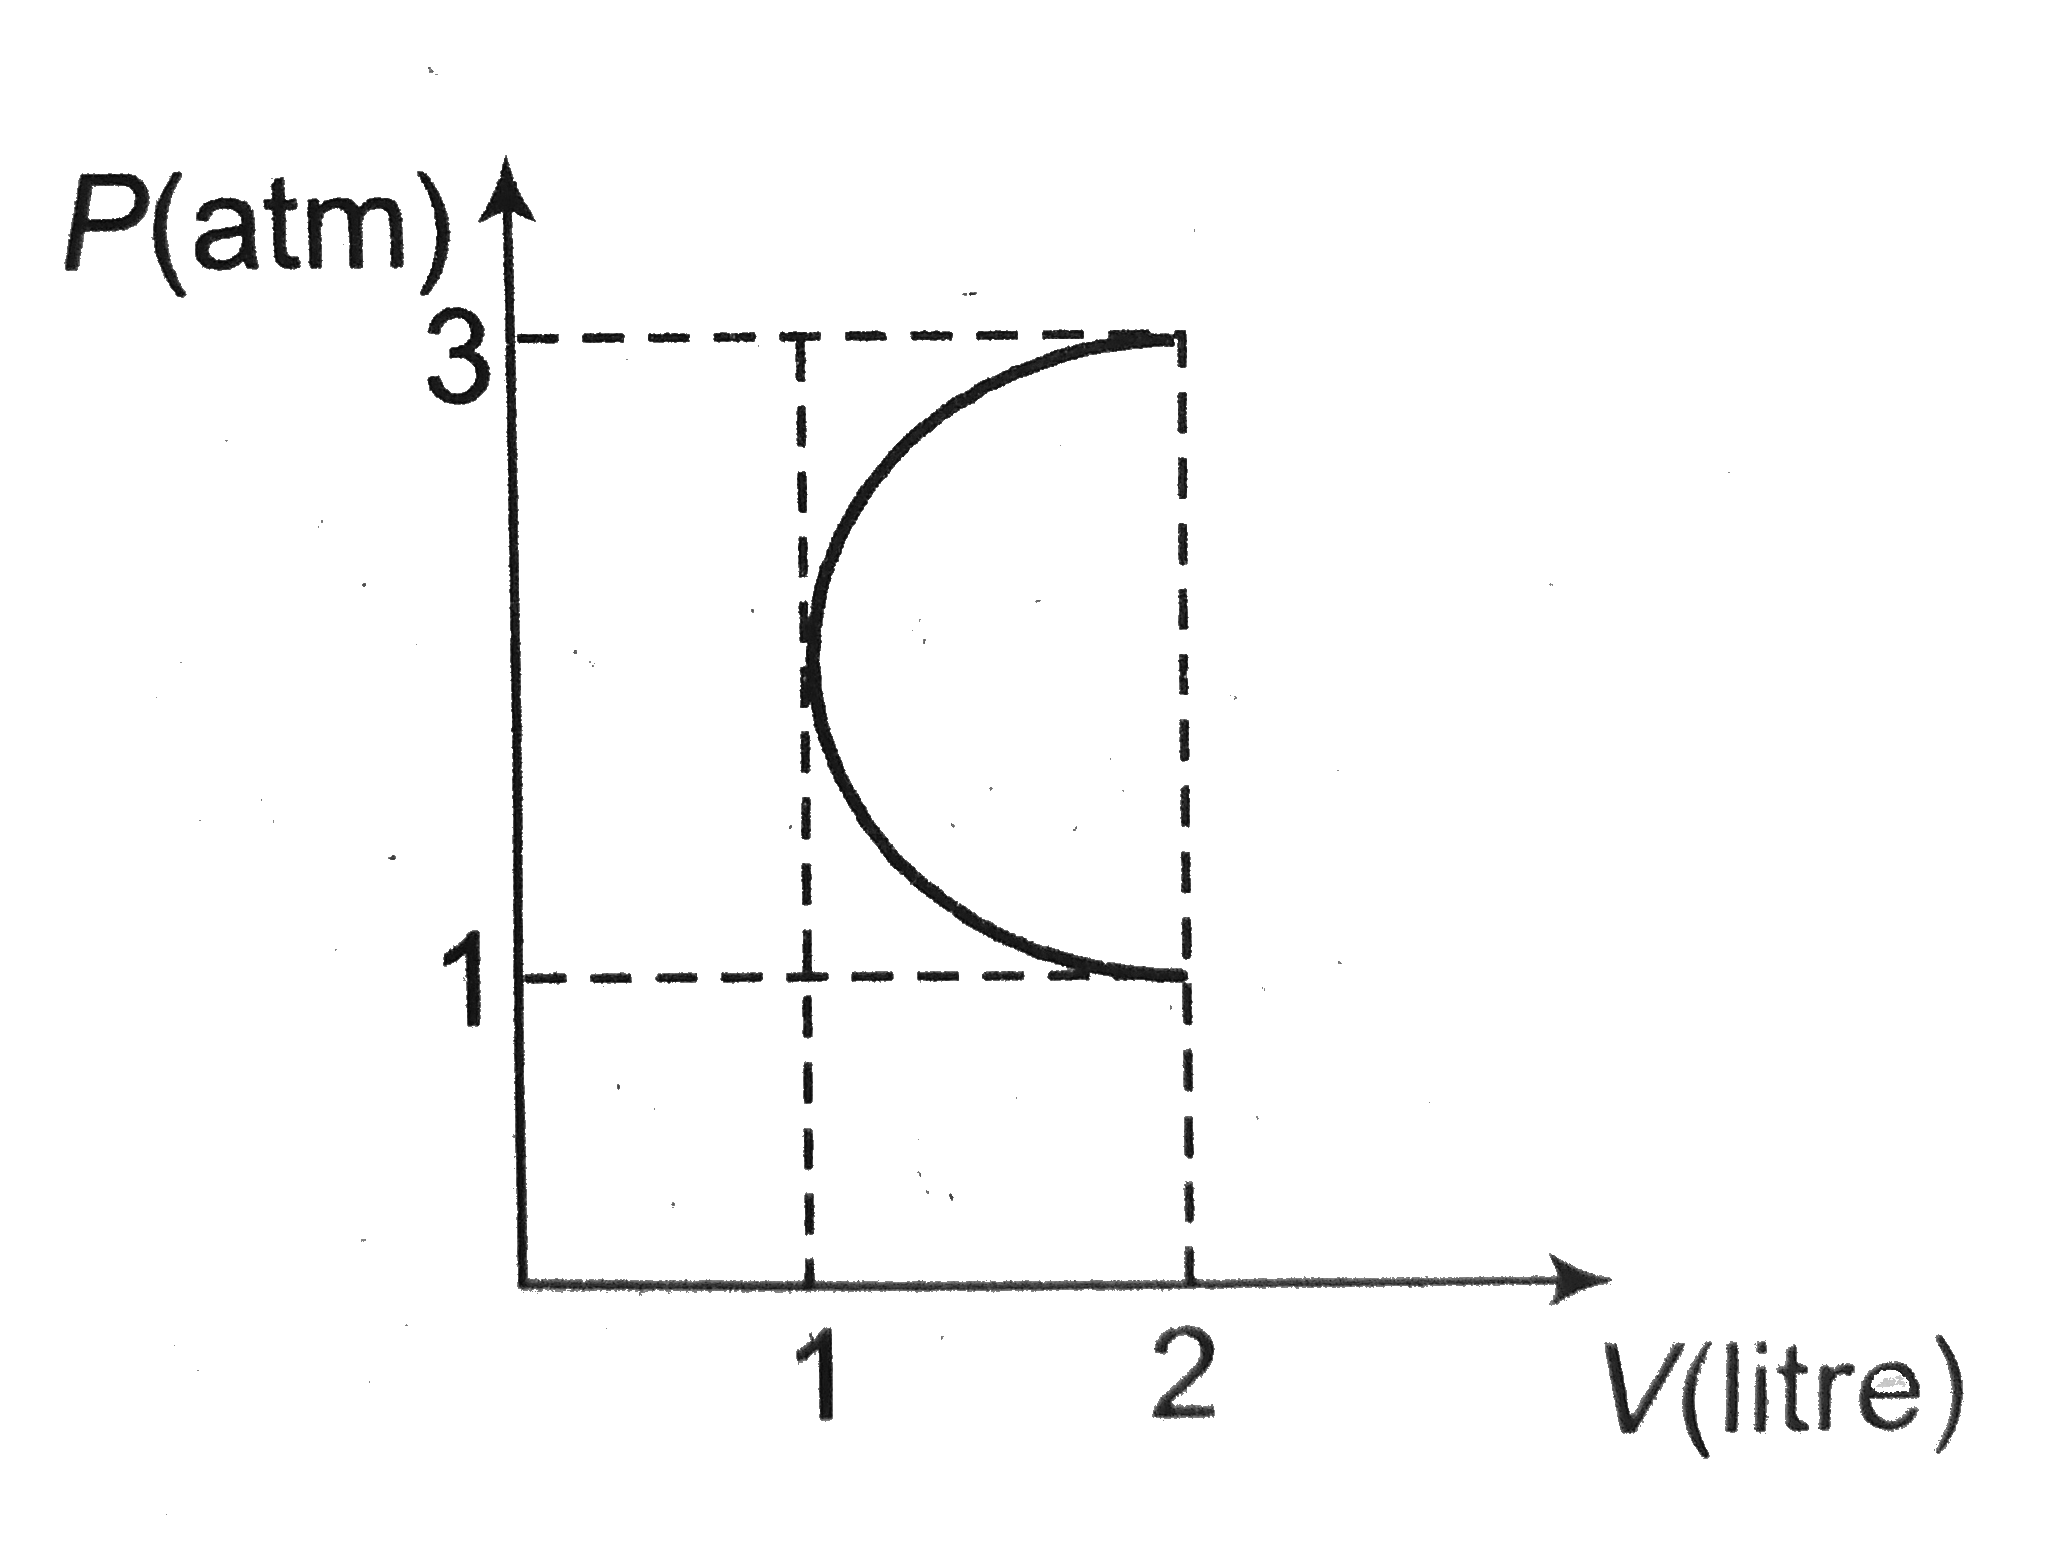
In the P−V diagram shown in figure ABC is a semicircle. The work done in the process ABC is
View Solution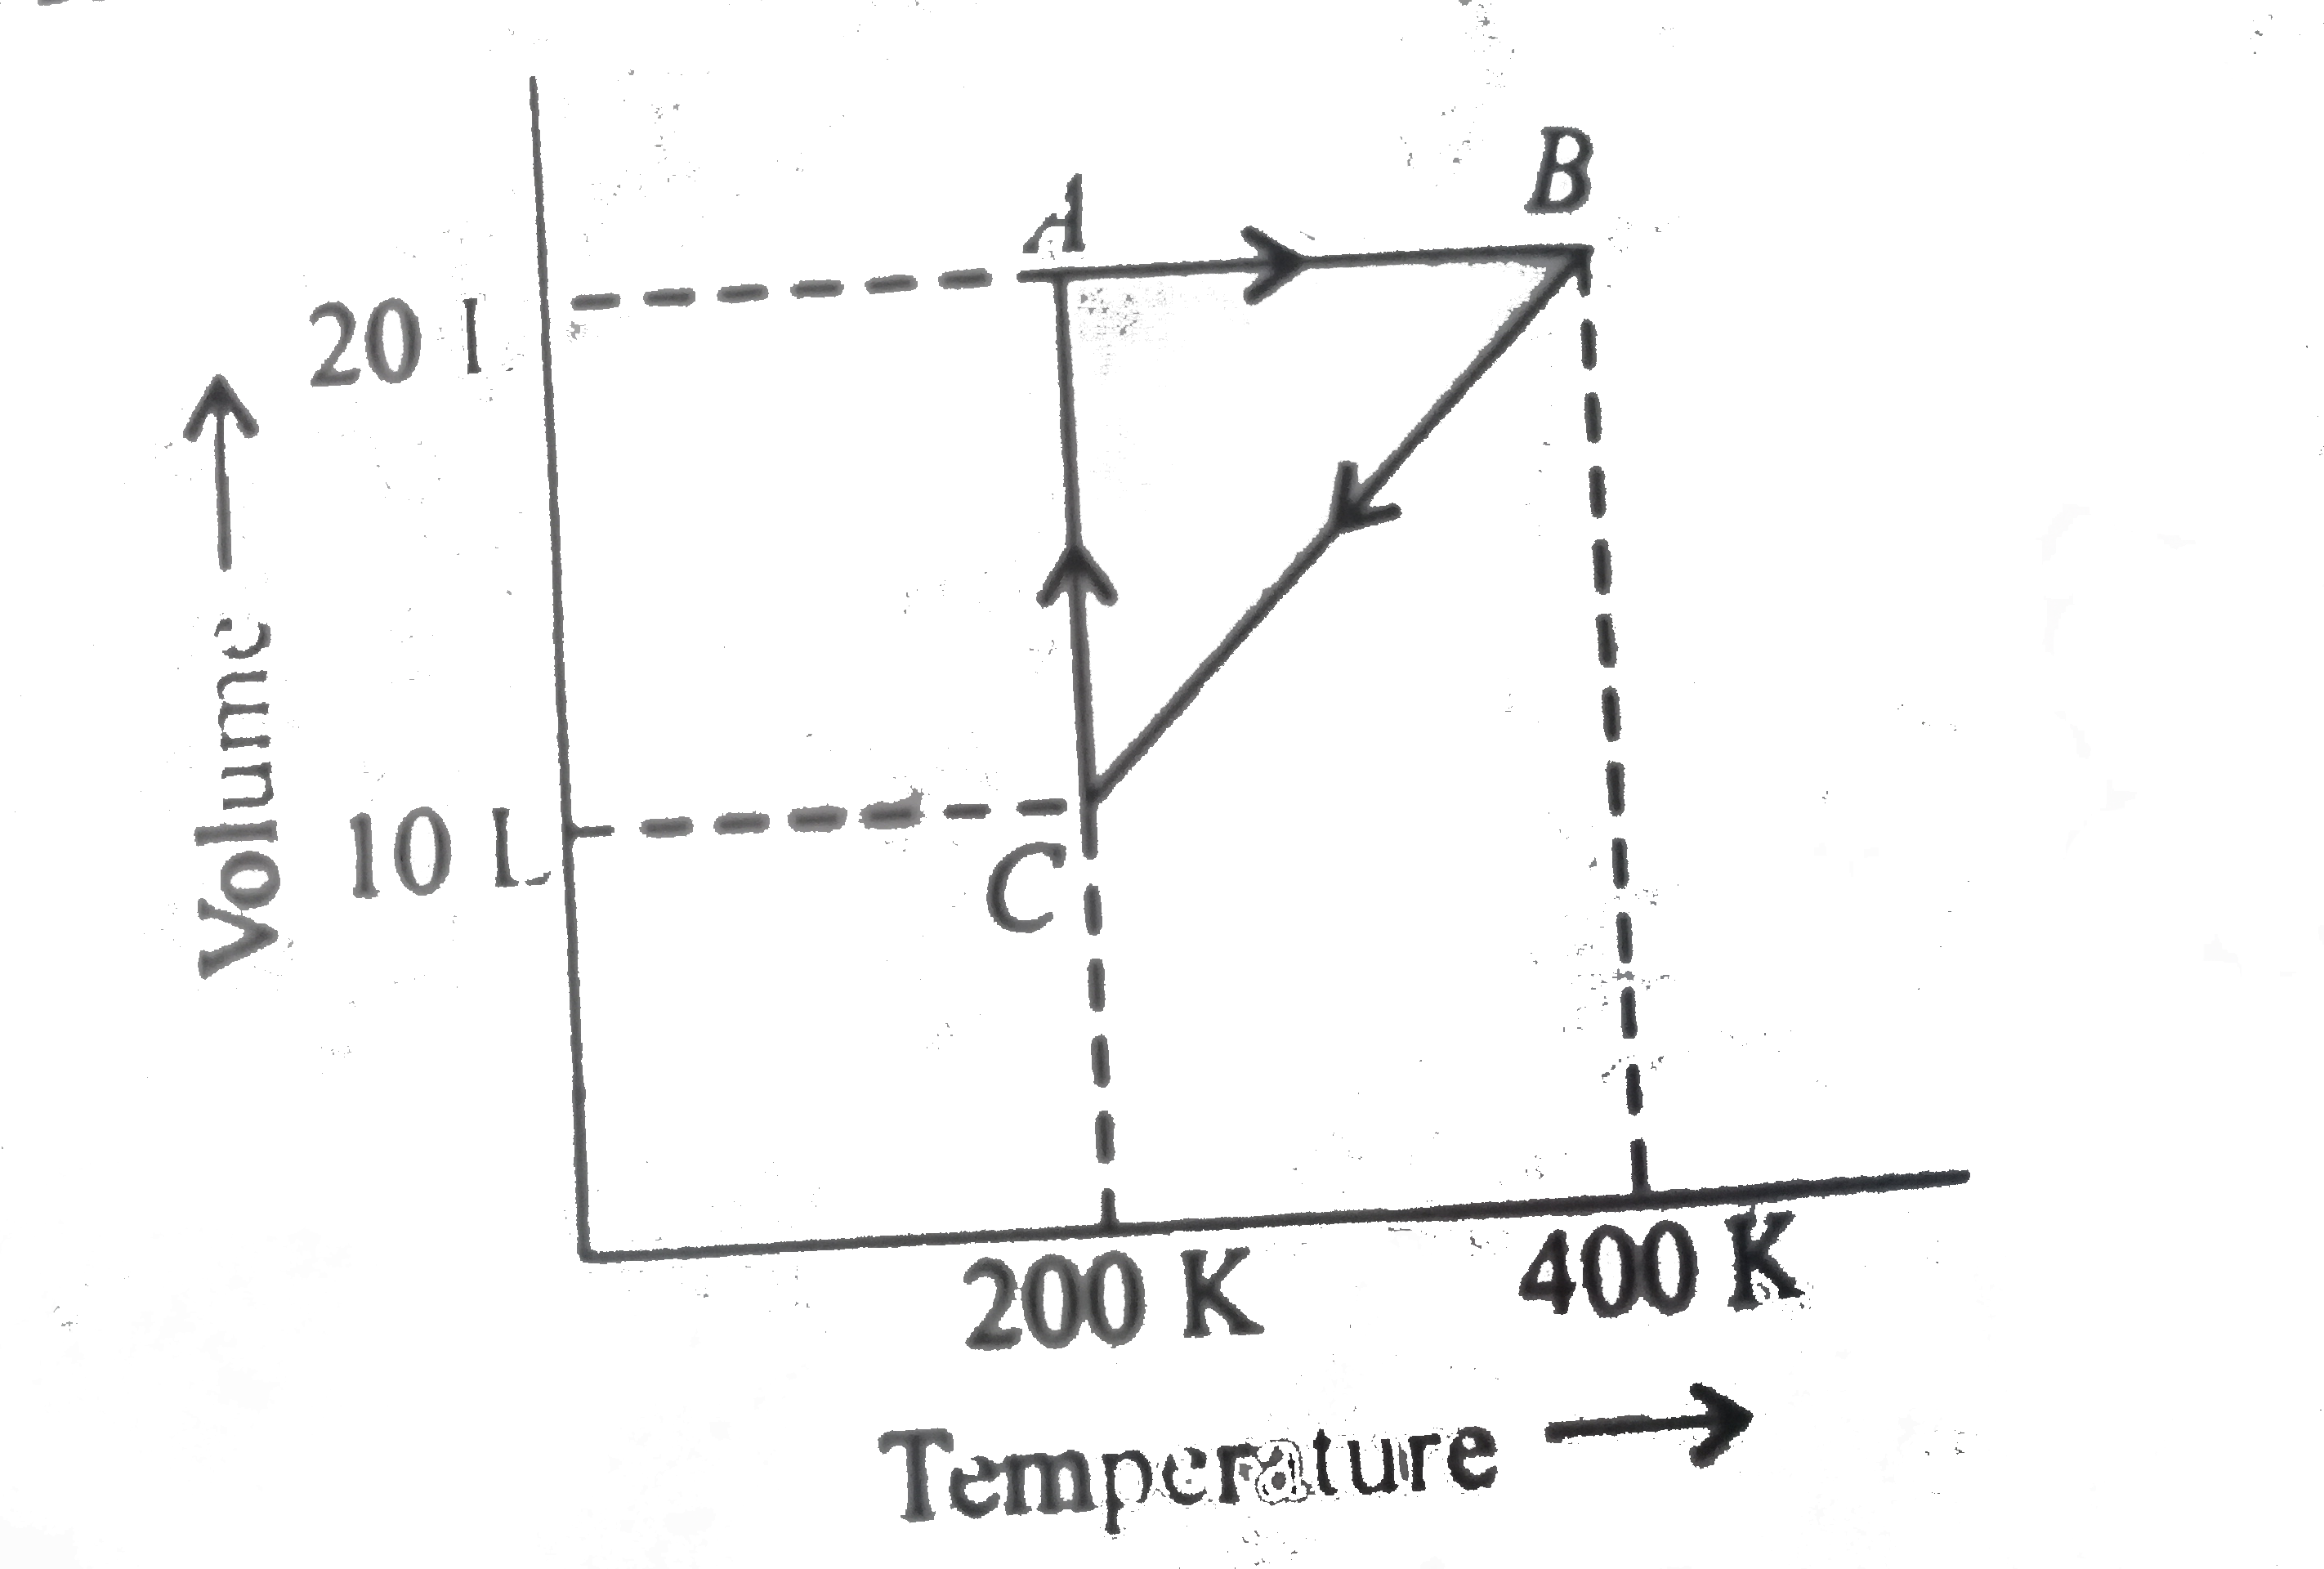
Work done in the process C→A is
View SolutionFind the work done by the gas in the process ABC.
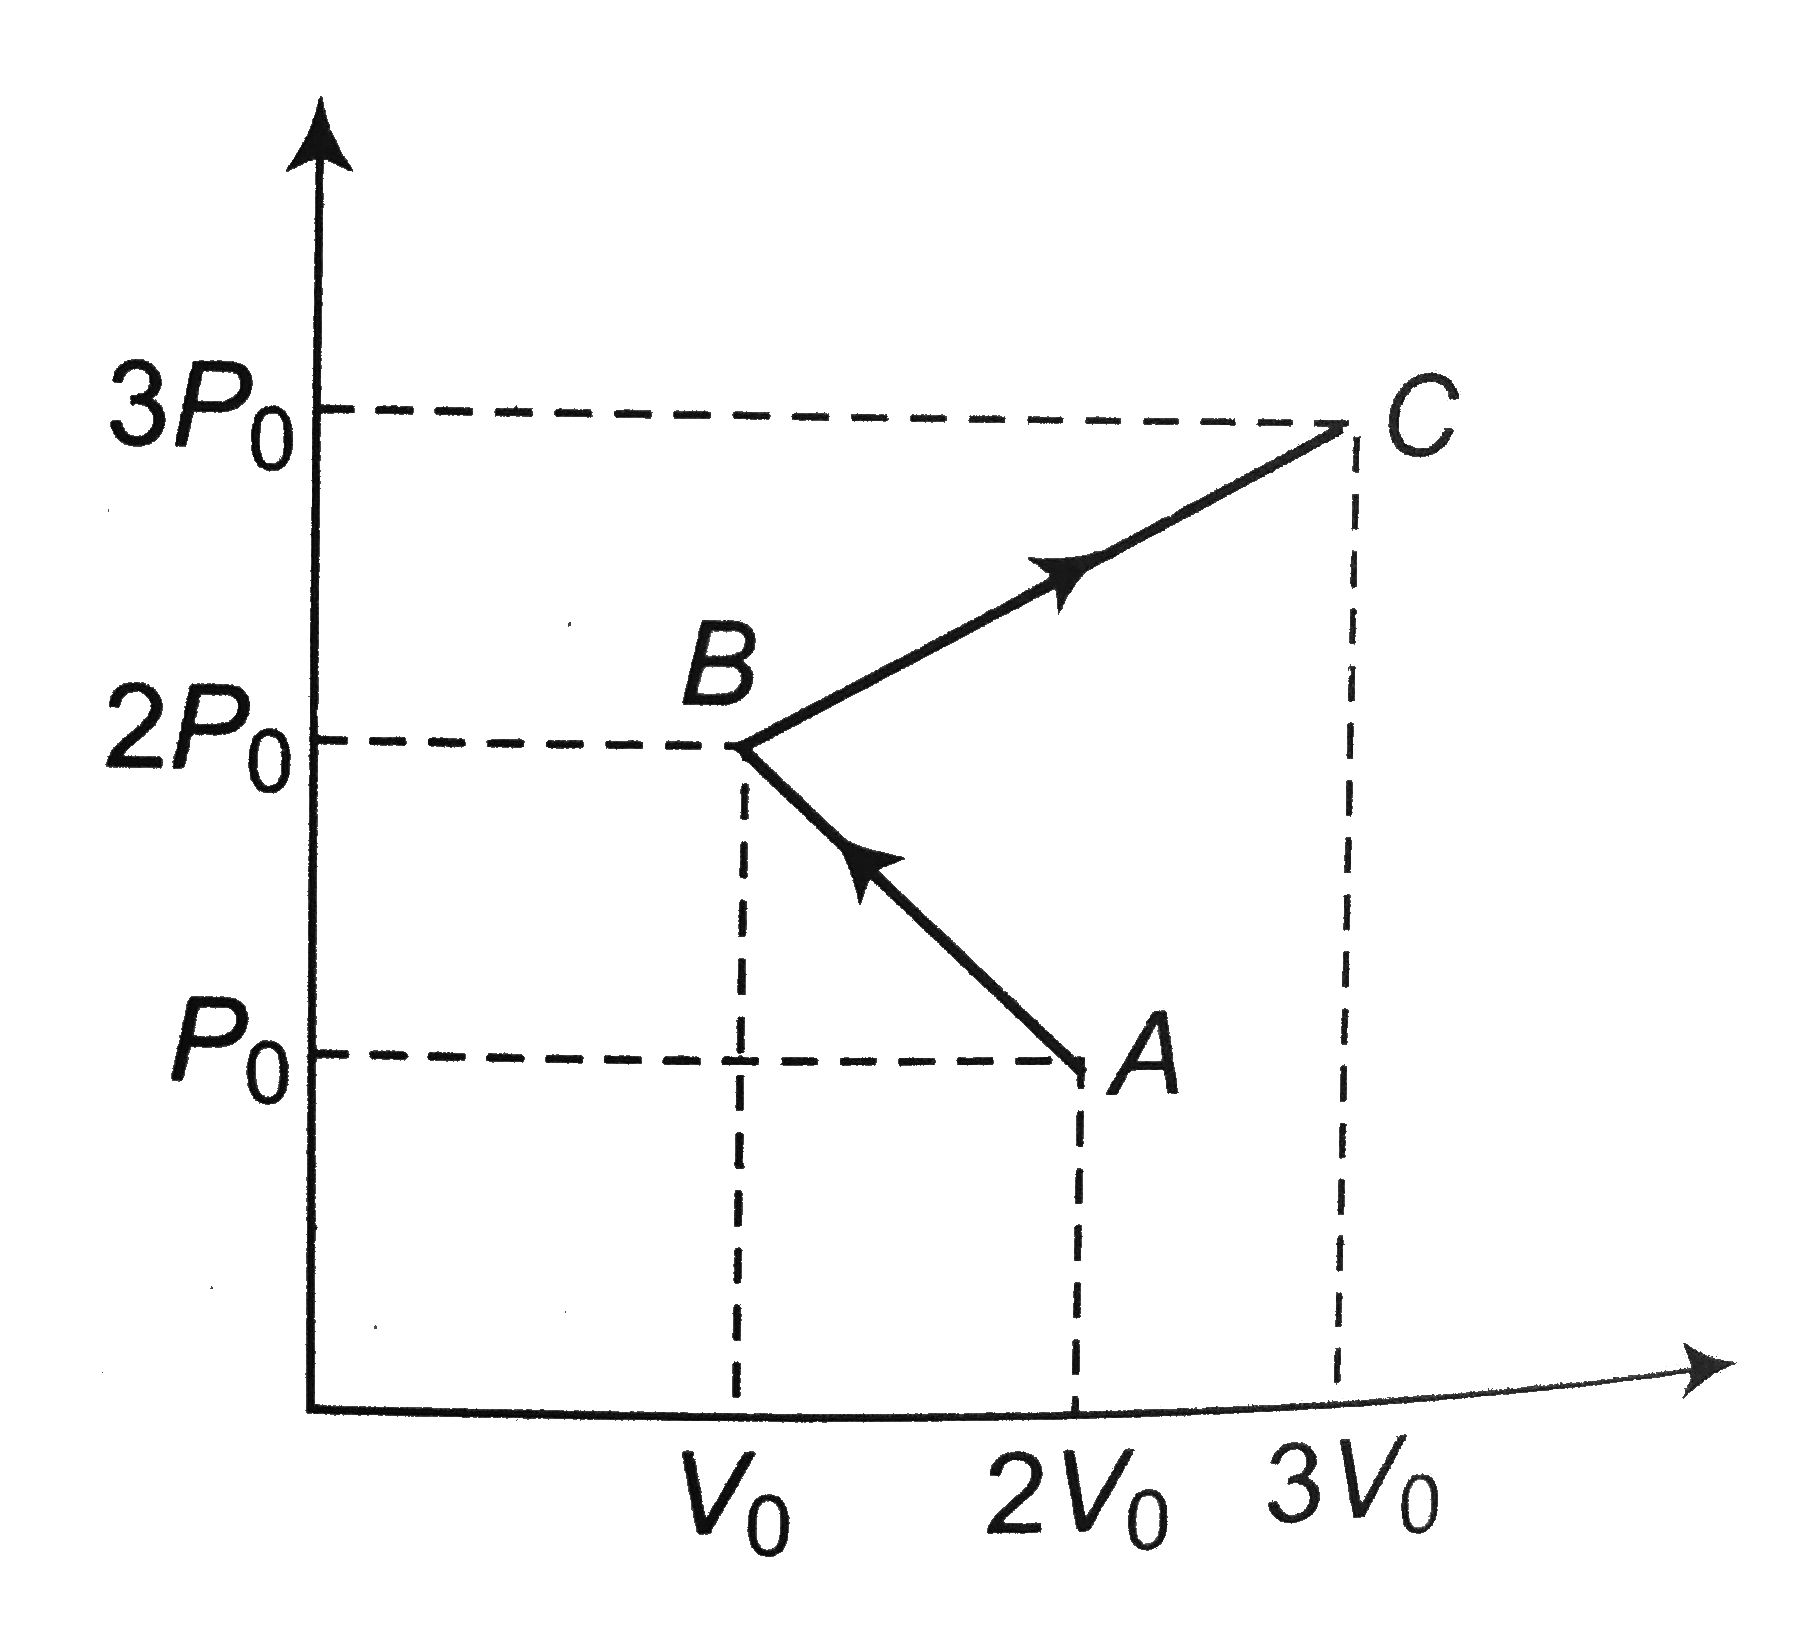
View SolutionP-V diagram of an ideal gas is as shown in figure. Work done by the gas in the process ABCD is

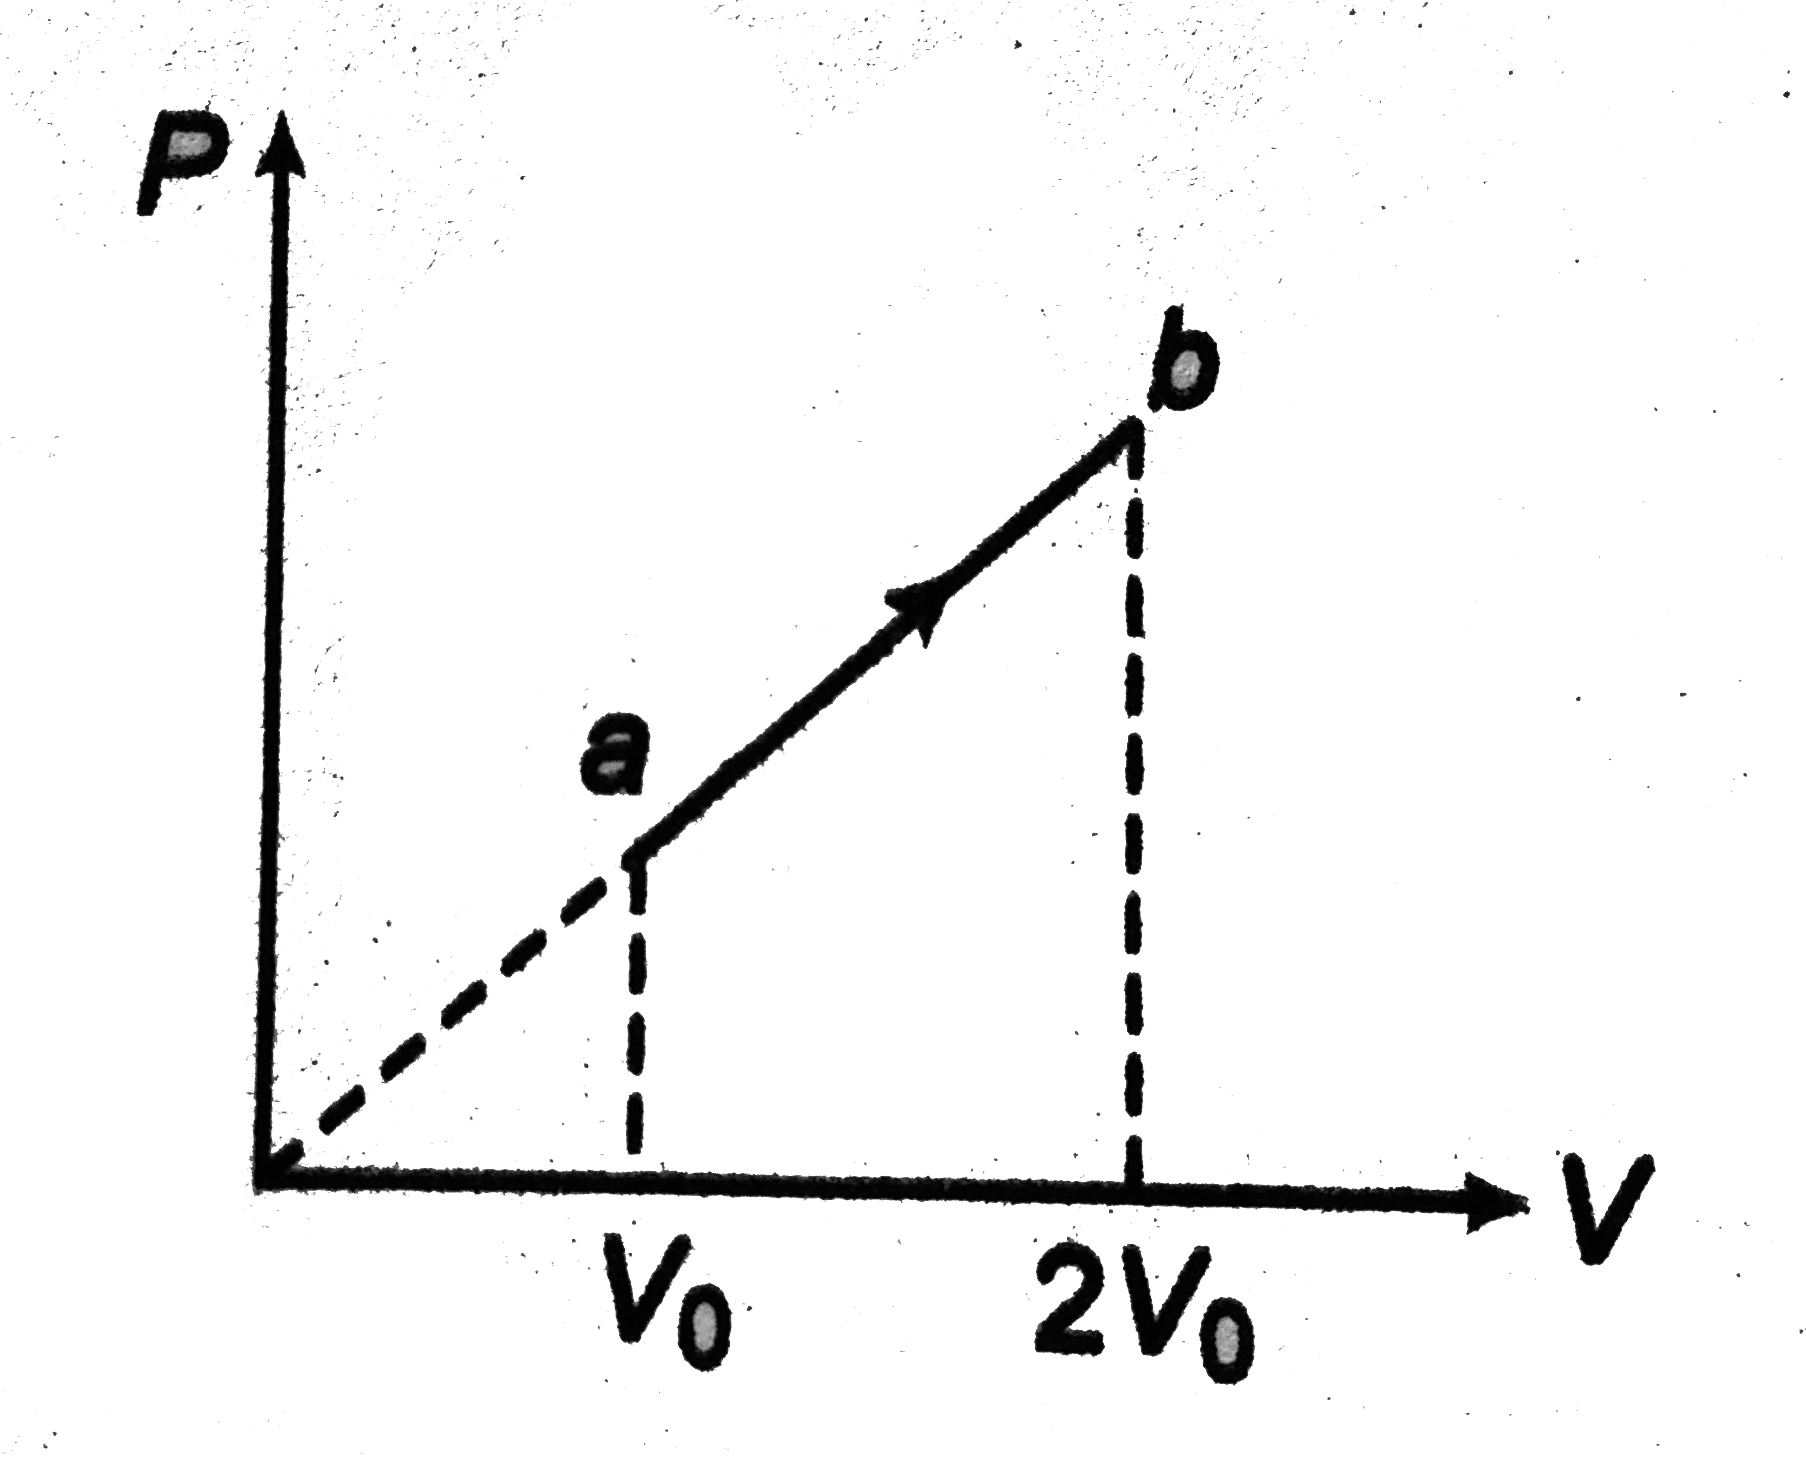
View SolutionIn the (p - V) diagram shown in figure, choose the correct options for the the process (a - b) :
 .
.
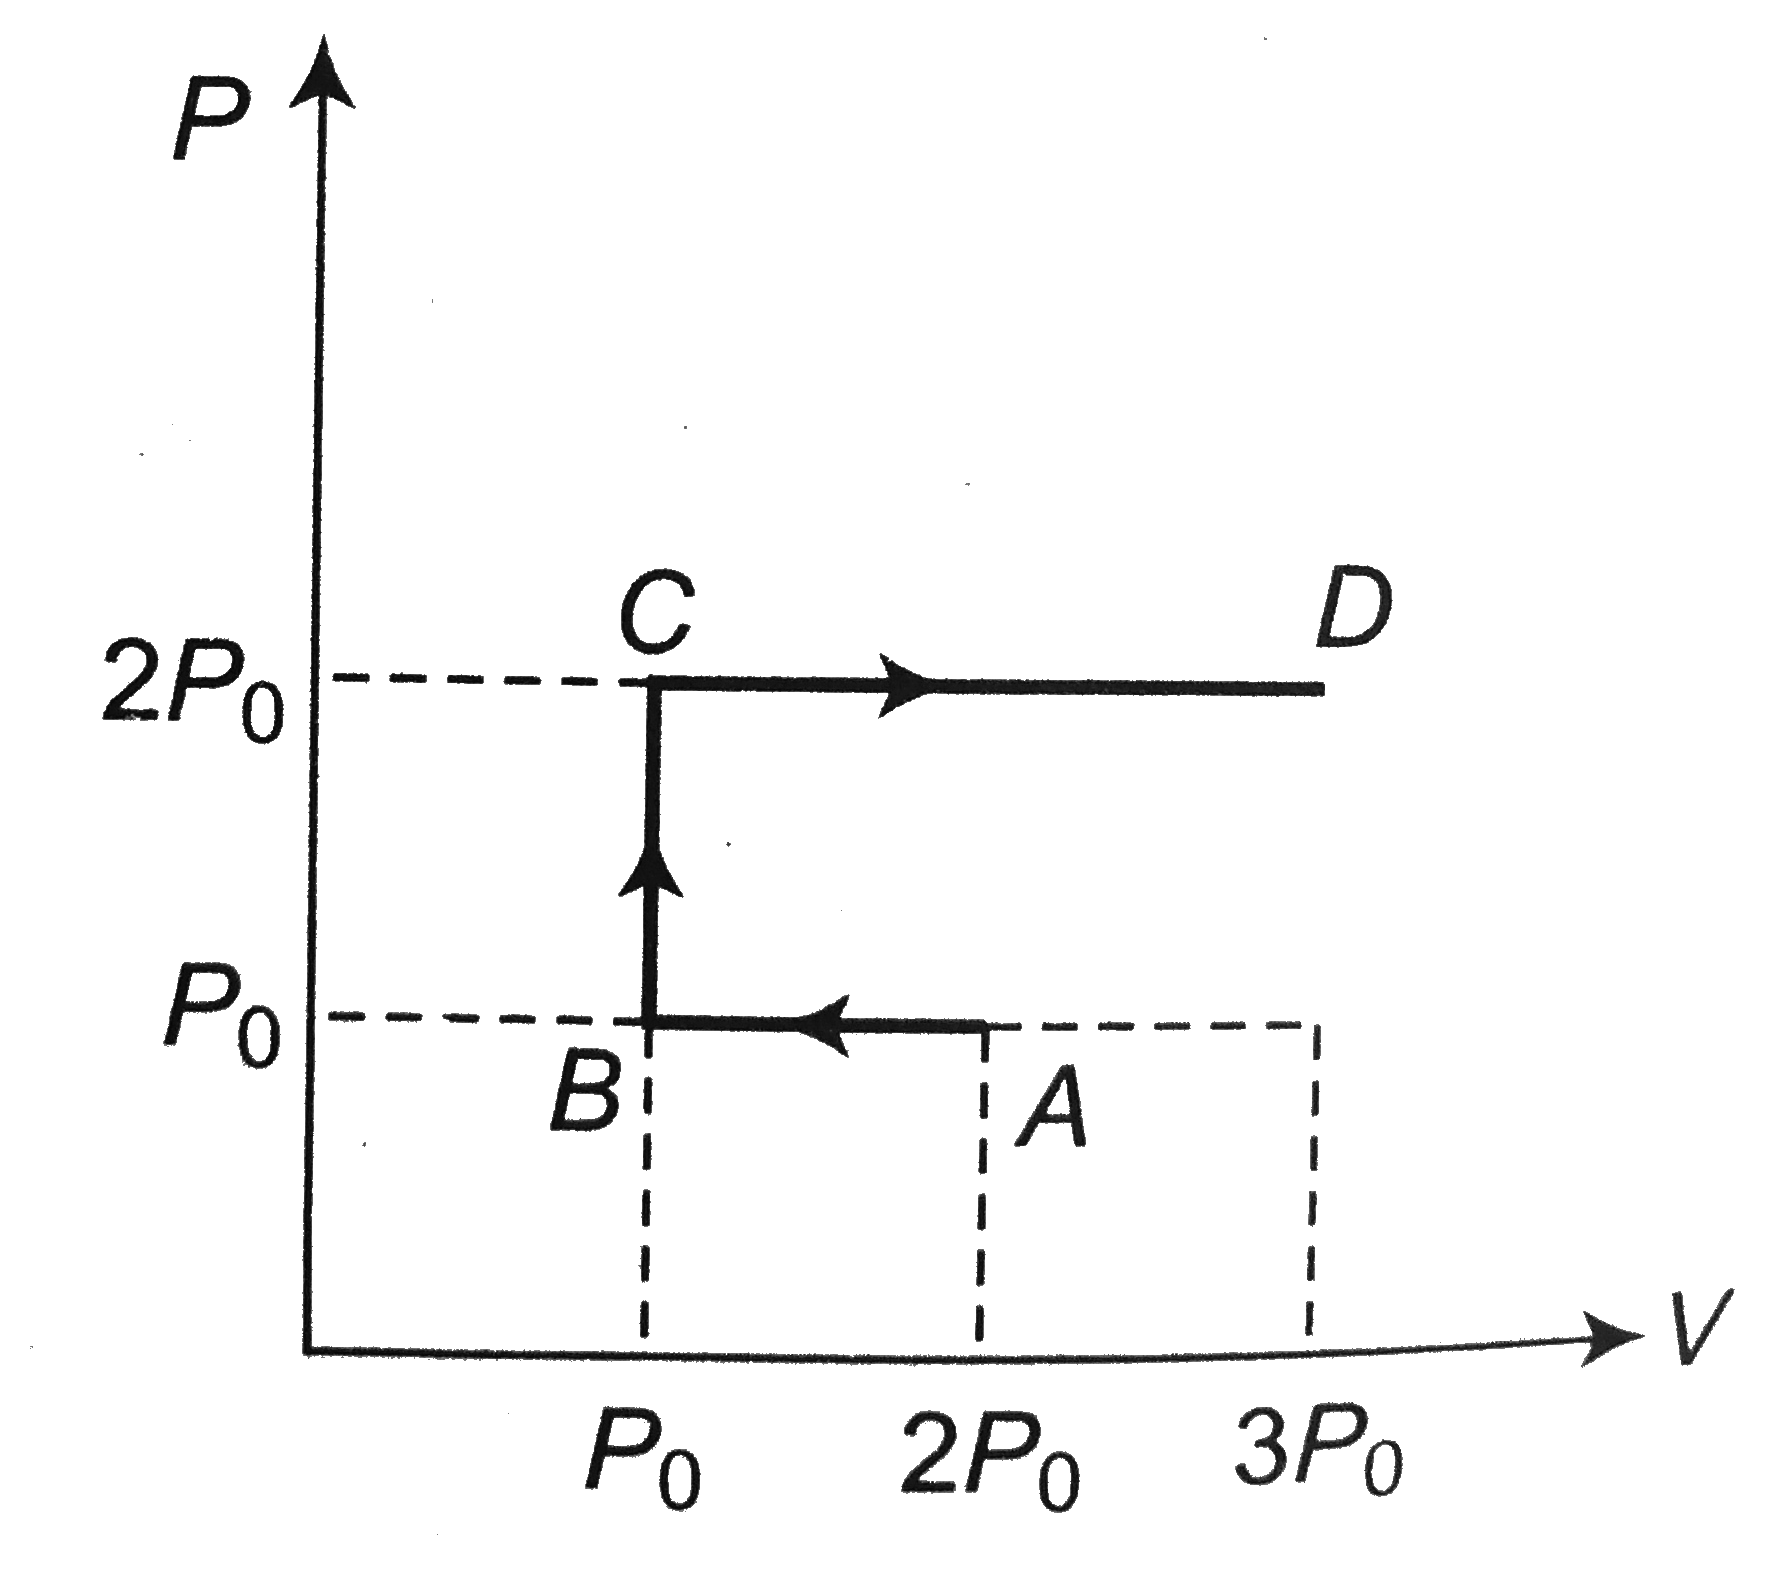
View SolutionP−V diagram of an ideal gas is as shown in figure. Work done by the gas in process ABCD is
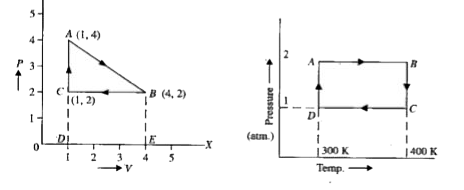
View SolutionThe PV diagram for cyclic process is a triangle ABC see Fig. drawn in order. The co-ordinates of A, B and Care (4,1), (2,4) and (2,1). The co-ordinates are in order of P and V in which P is Nm2 and volume is in litre. Calculate the work done during the process from A to B, B to C and C to A. Also calculate the work done in the complete cycle.
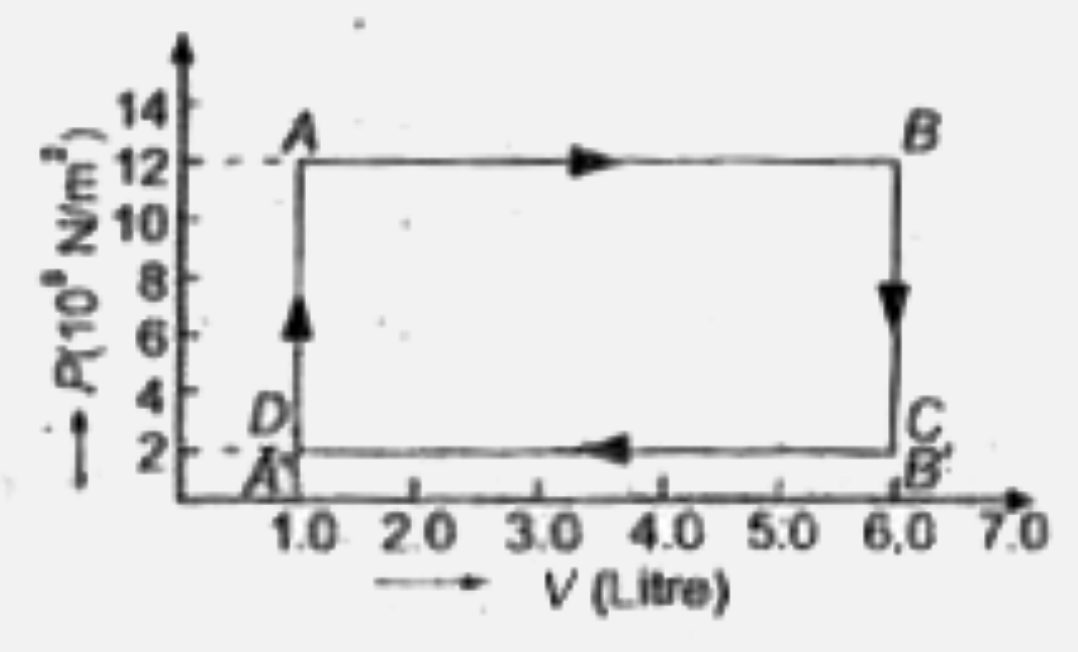
View SolutionThe figure shows a P.V graph of the thermodynamic behavious of an ideal gas. Find out form this graph (i) work done by the gas in the process A→B,B→C,C→DandD→A. (ii) work done by the gas in complete cycle A→B→C→D→A.
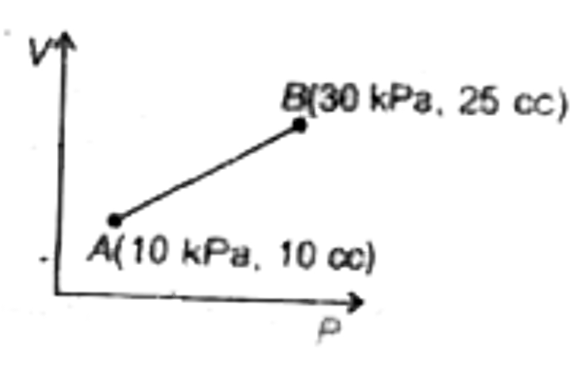
View SolutionWork done for the process shownin the figure is
View SolutionWork done in the cyclic process shown in figure is
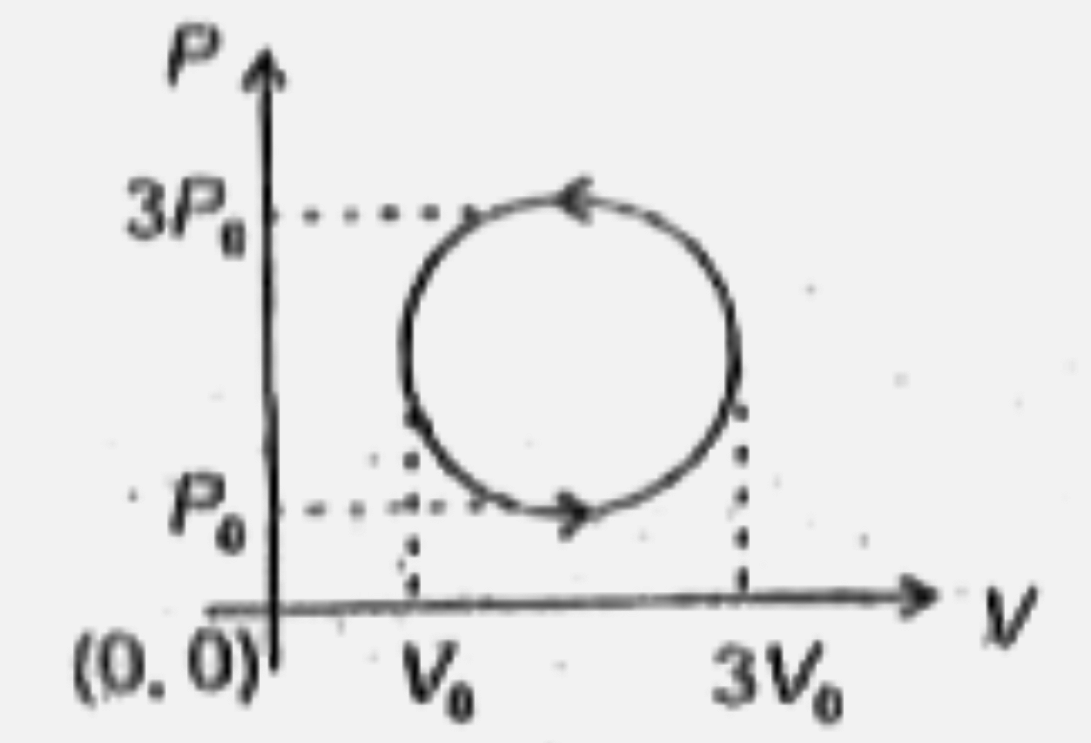
View Solution
