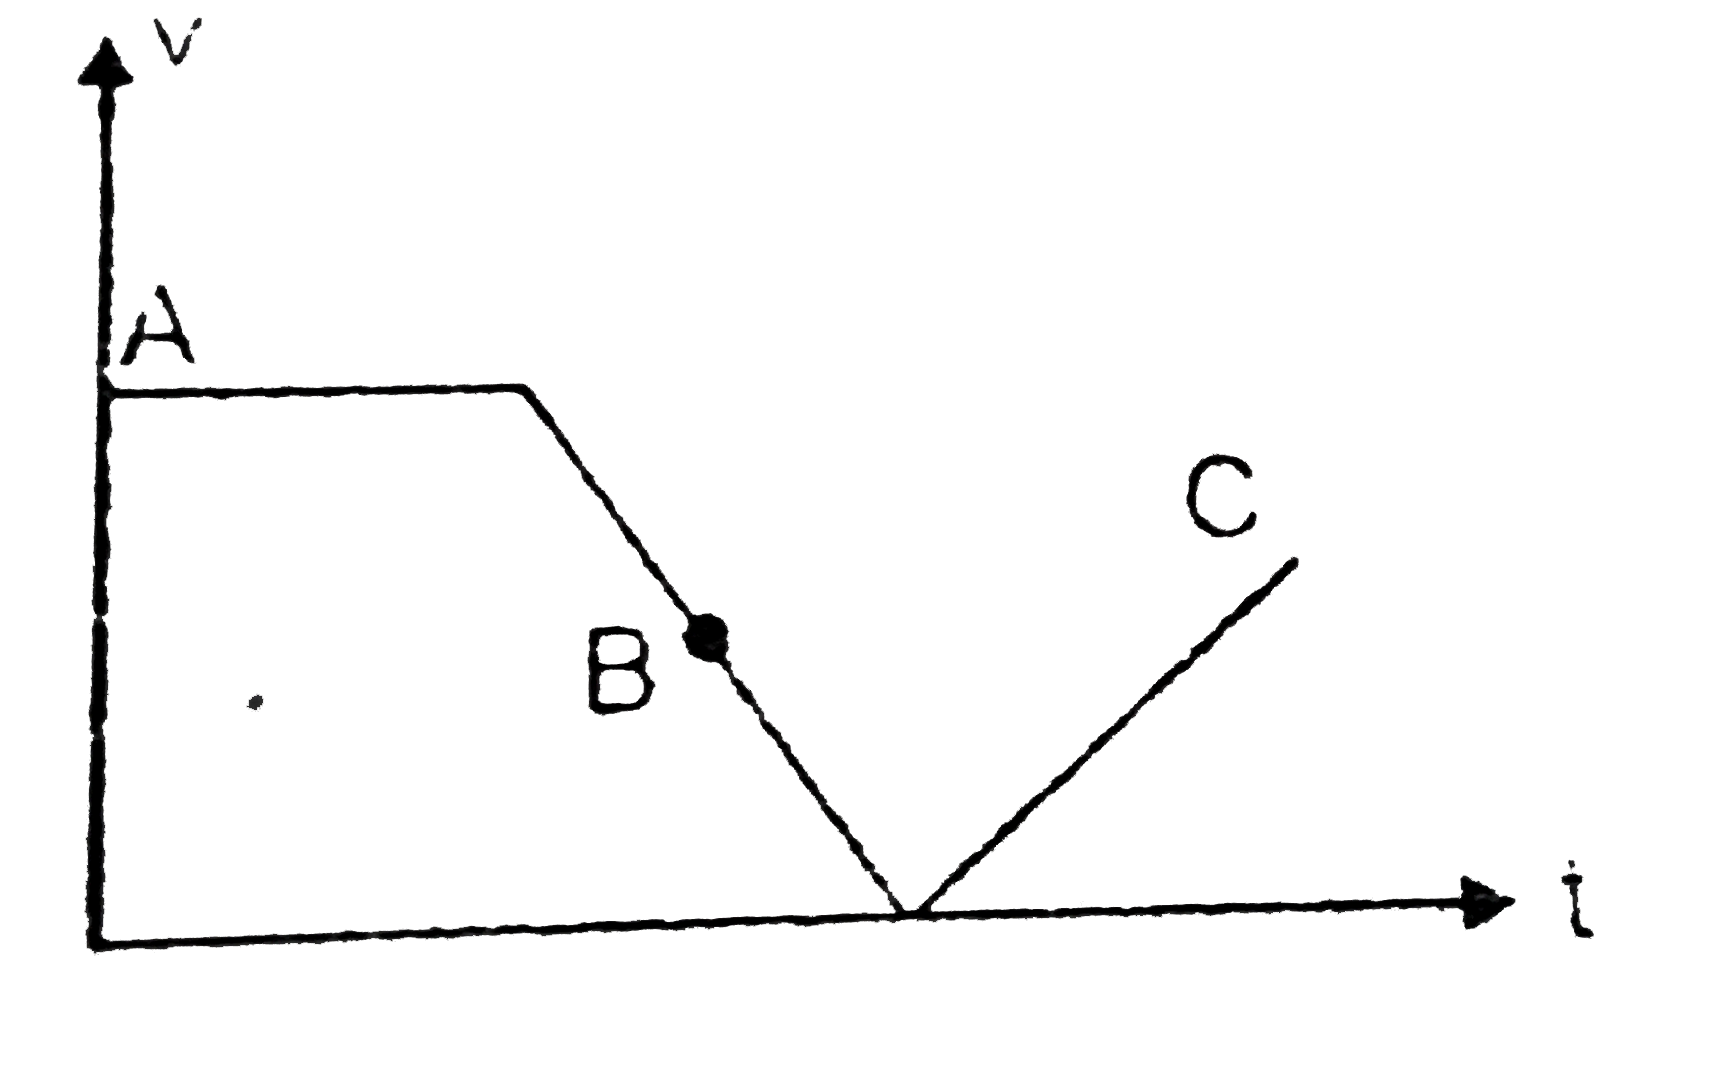
The velocity-time graph of a body moving in a straight line is shown in Fig. Find the displacement and distance travelled by the body in 10 sec.
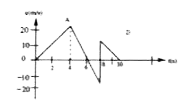
The area enclosed by velocity-time graph with time axis measures the displacement travelled in the given time.
S=60m,distance=80 m
Similar Questions
The velocity time graph of a body moving in a straight line is shown in the figure. The displacement and distance travelled by the body in 6 sec are respectively.
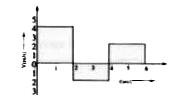
View Solution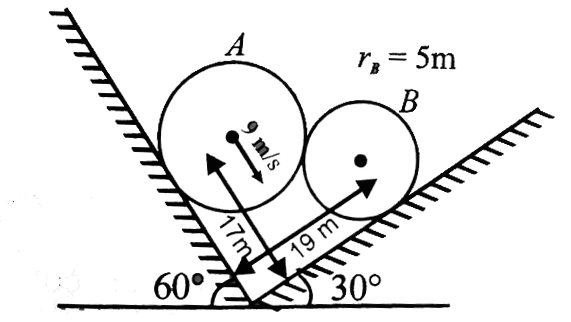
System is shown in the figure. Velocity of sphere A is 9 ms. Find the speed of sphere B.
View SolutionThe velocity-time graph of a particle moving in a staight line is shown in the . Find the displacement and the distance trav elled by the particle in 6s.
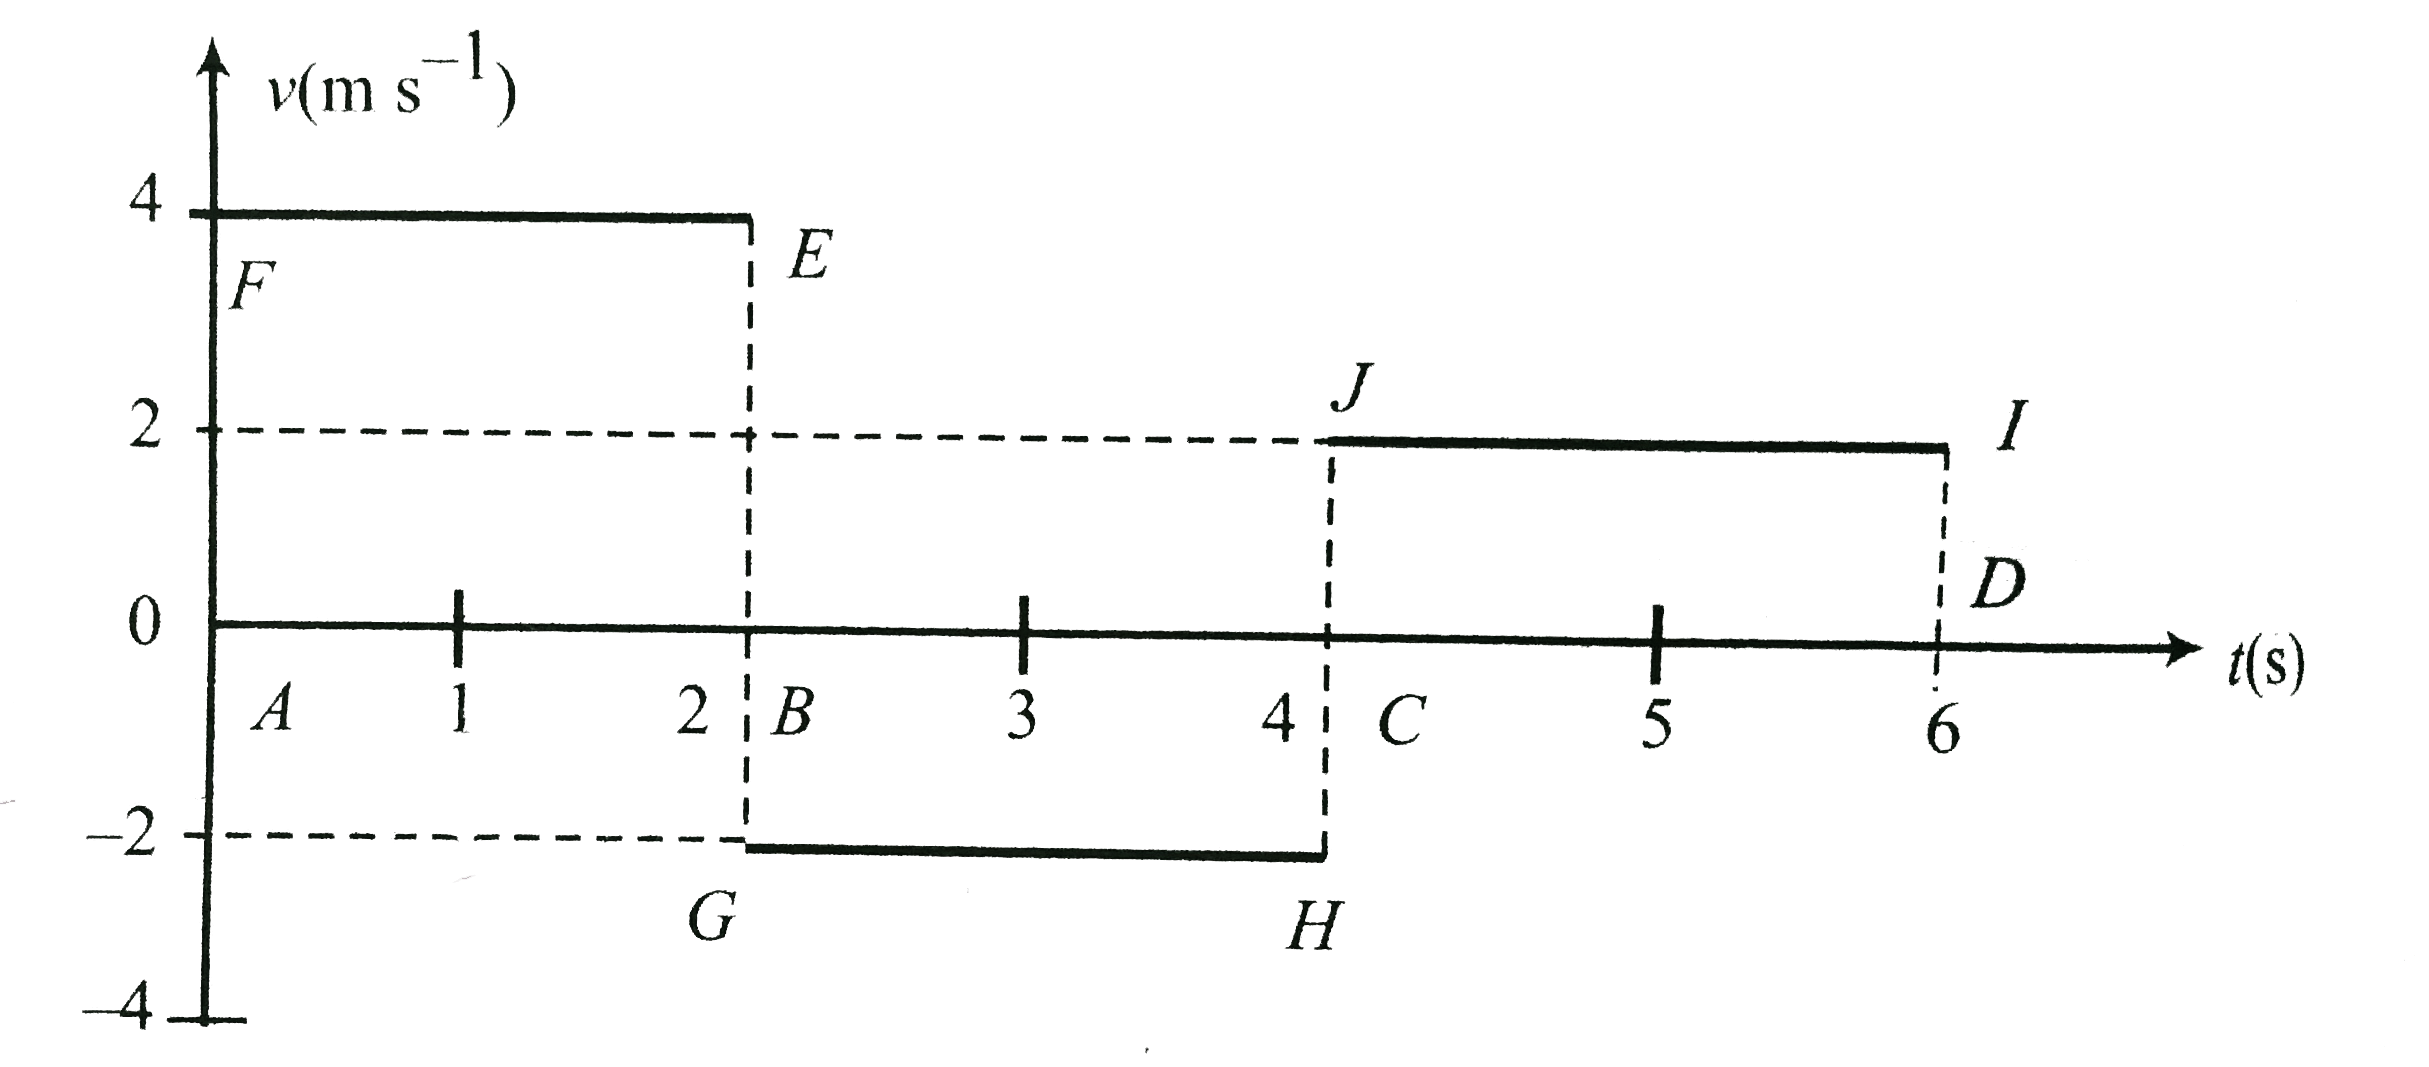 .
.
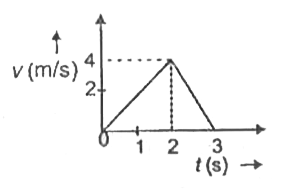
View SolutionThe velocity versus time graph of a body moving in a straight line is as shown in the figure below
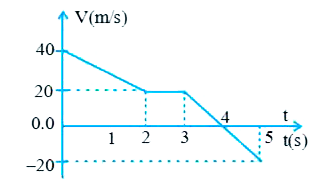
View SolutionIn the given v-t graph, the distance travelled by the body in 5 sec will be :
View SolutionThe figure below shows the velocity-time graph of a body moving in a straight line.
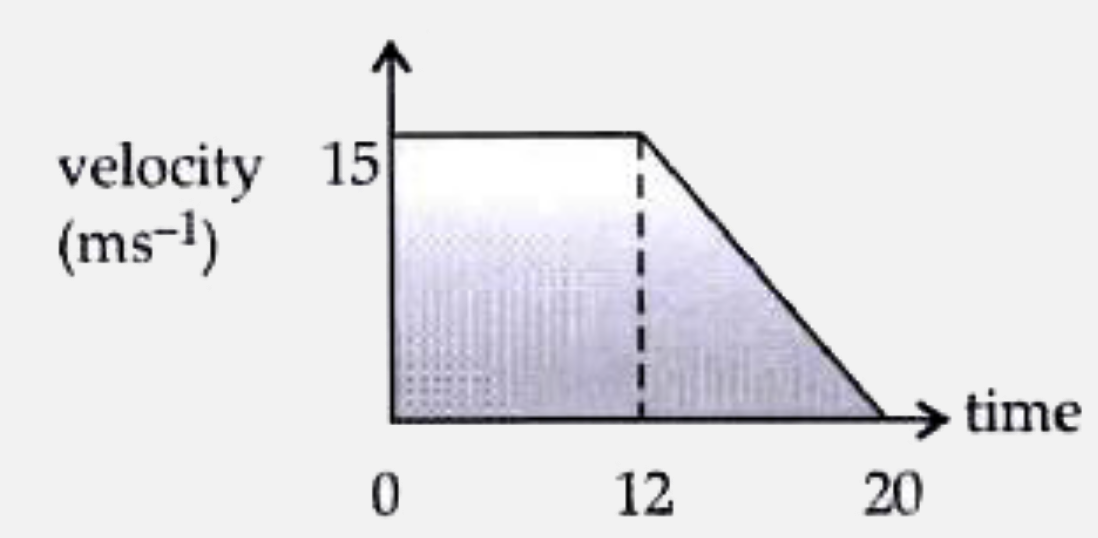
Find the total displacement of the body.
View SolutionThe velocity versus time graph of a body in a straight line is as shown in figure. The displacment of the body in five seconds is
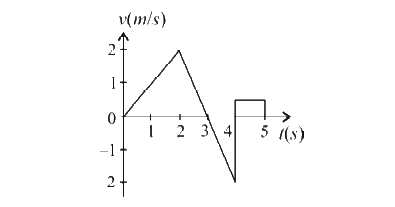
View SolutionDisplacement time graph of a particle moving in a straight line is a shown in figure.

View SolutionThe velocity time graph of a body is shown in fig. it indicates that :
View SolutionVelocity displacement graph of a particle moving in a straight line is as shown in figure.

View Solution
